
AEConsole
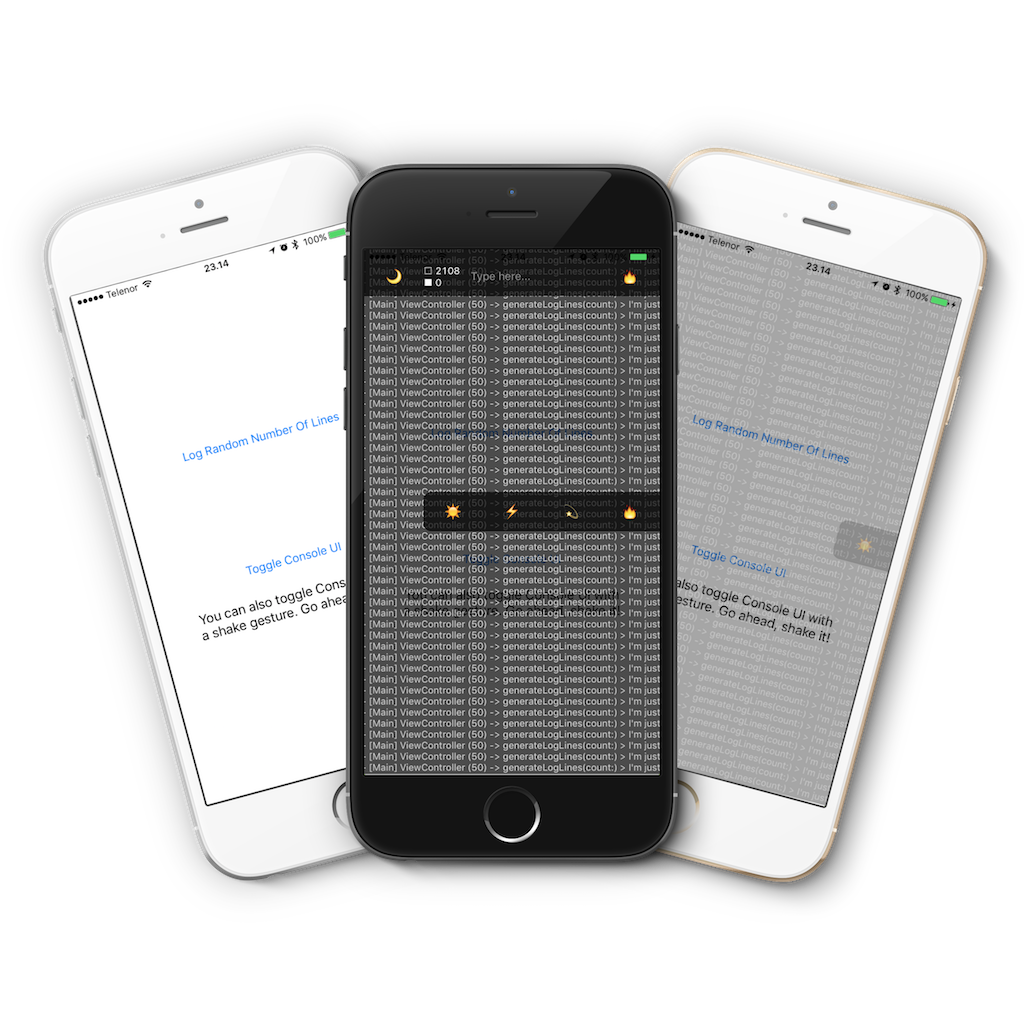
Customizable Console UI overlay with debug log on top of your iOS App
AEConsole is built on top of AELog, so you should probably see that first.
I wanted to see what's happening 'under the hood' while testing some app AFK (ex. outside). Then I made it possible. Hope you'll like it too, happy coding!
Index
Features
- All the things from AELog plus:
- Console UI overlay on top of your App
- Debug log on device in real time
- Automatic row height for all log lines
- Forward touches to your App
- Shake to toggle Console UI
- Filter log to find exactly what you need
- Export log to file if you need it for later
- Share log file easily via system sharing sheet
- Customize look as you like it
Usage
Calling Console.shared.configure(in: window) will add Console.View as a subview to your App's window and make it hidden by default. Whenever you need Console UI, you just make a shake gesture and it's there! When you no longer need it, shake again and it's gone.
The rest is up to AELog's logging functionality. Whatever is logged with it, will show up in Console.View.
// MARK: - Console configuration

func application(_ application: UIApplication,
                 didFinishLaunchingWithOptions launchOptions: [UIApplicationLaunchOptionsKey: Any]?) -> Bool
{
    /// - Note: Access Console settings
    let settings = Console.shared.settings

    /// - Note: Customize Console settings like this, these are defaults:
    settings.isShakeGestureEnabled = true
    settings.backColor = UIColor.black
    settings.textColor = UIColor.white
    settings.fontSize = 12.0
    settings.rowSpacing = 4.0
    settings.opacity = 0.7

    /// - Note: Configure Console in app window (it's recommended to skip this for public release)
    Console.shared.configure(in: window)

    /// - Note: Log something with AELog
    aelog()

    return true
}
// MARK: - Additional Console API

/// - Note: Check if Console is hidden
Console.shared.isHidden

/// - Note: Toggle Console visibility
Console.shared.toggle()

/// - Note: Add any log line manually
Console.shared.addLogLine(line: "Hello!")

/// - Note: Export log file manually
Console.shared.exportLogFile { (fileURL) in
    do {
        let url = try fileURL()
        /// - Note: do something with a log file at given file URL...
    } catch {
        print(error)
    }
}
Quick Help
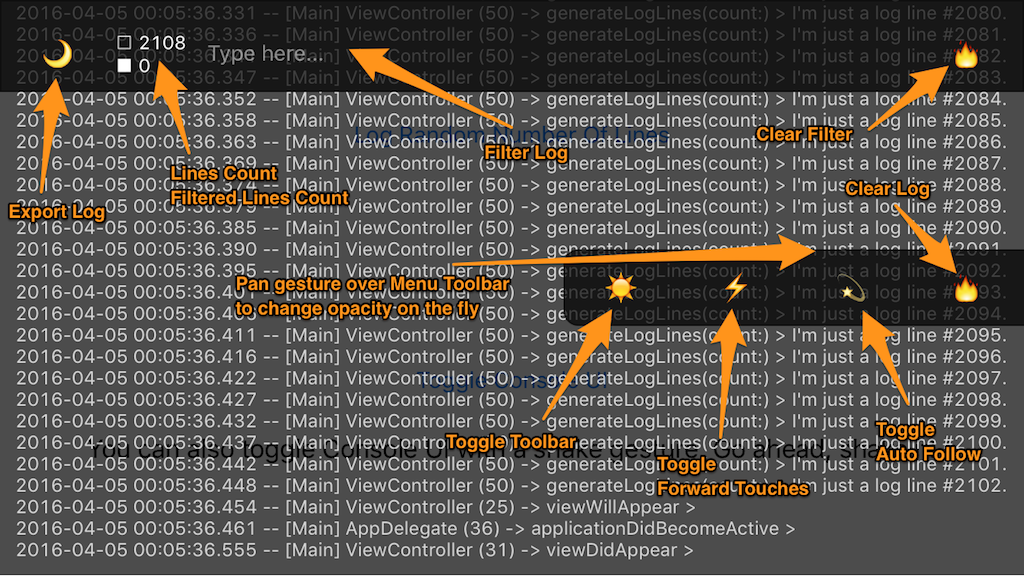
This should explain all the features of Console UI:
| Feature | Description |
|---|---|
| Export Log | will make AELog_{timestamp}.txt file in Application Documents directory and present sharing sheet. |
| Filter Log | filter is not case sensitive. |
| Toggle Toolbar | works for both filter and menu toolbars simultaneously. |
| Toggle Forward Touches | when active you can interact with your App, otherwise you can interact with the log. |
| Toggle Auto Follow | when active it will automatically scroll to the new log lines, otherwise it will stay put. |
| Clear Log | you can't undo this. |
| Pan Gesture over Menu Toolbar | left is more transparent, right is more opaque. |
Installation
-
.package(url: "https://github.com/tadija/AEConsole.git", from: "0.7.1")
-
github "tadija/AEConsole" -
pod 'AEConsole'
License
AEConsole is released under the MIT license. See LICENSE for details.
 575 Dec 28, 2022
 2k Dec 27, 2022
 408 Nov 22, 2022
 3.4k Dec 28, 2022

 1.2k Dec 30, 2022
 8.9k Jan 6, 2023
 733 Oct 29, 2022
 2.1k Jan 8, 2023

 1.4k Dec 29, 2022


 650 Jan 1, 2023
 1.4k Dec 31, 2022
 116 Jan 3, 2023
 119 Dec 27, 2022
 3.7k Dec 23, 2022
 498 Dec 24, 2022
 5.9k Dec 24, 2022
 631 Jan 3, 2023
 13.3k Dec 31, 2022
 1.8k Jan 3, 2023