Xray is viewDebugging tool for iOS, tvOS, watchOS and macOS

Related tags

Debugging XRay
Overview

XRay

XRay is view debugging tool for iOS. Currently, XRay can show all of the view hierarchies in UIKit. For SwiftUI, I'm working on it.

XRay helps you debugging view without using XCode's Debug View Hierarchy
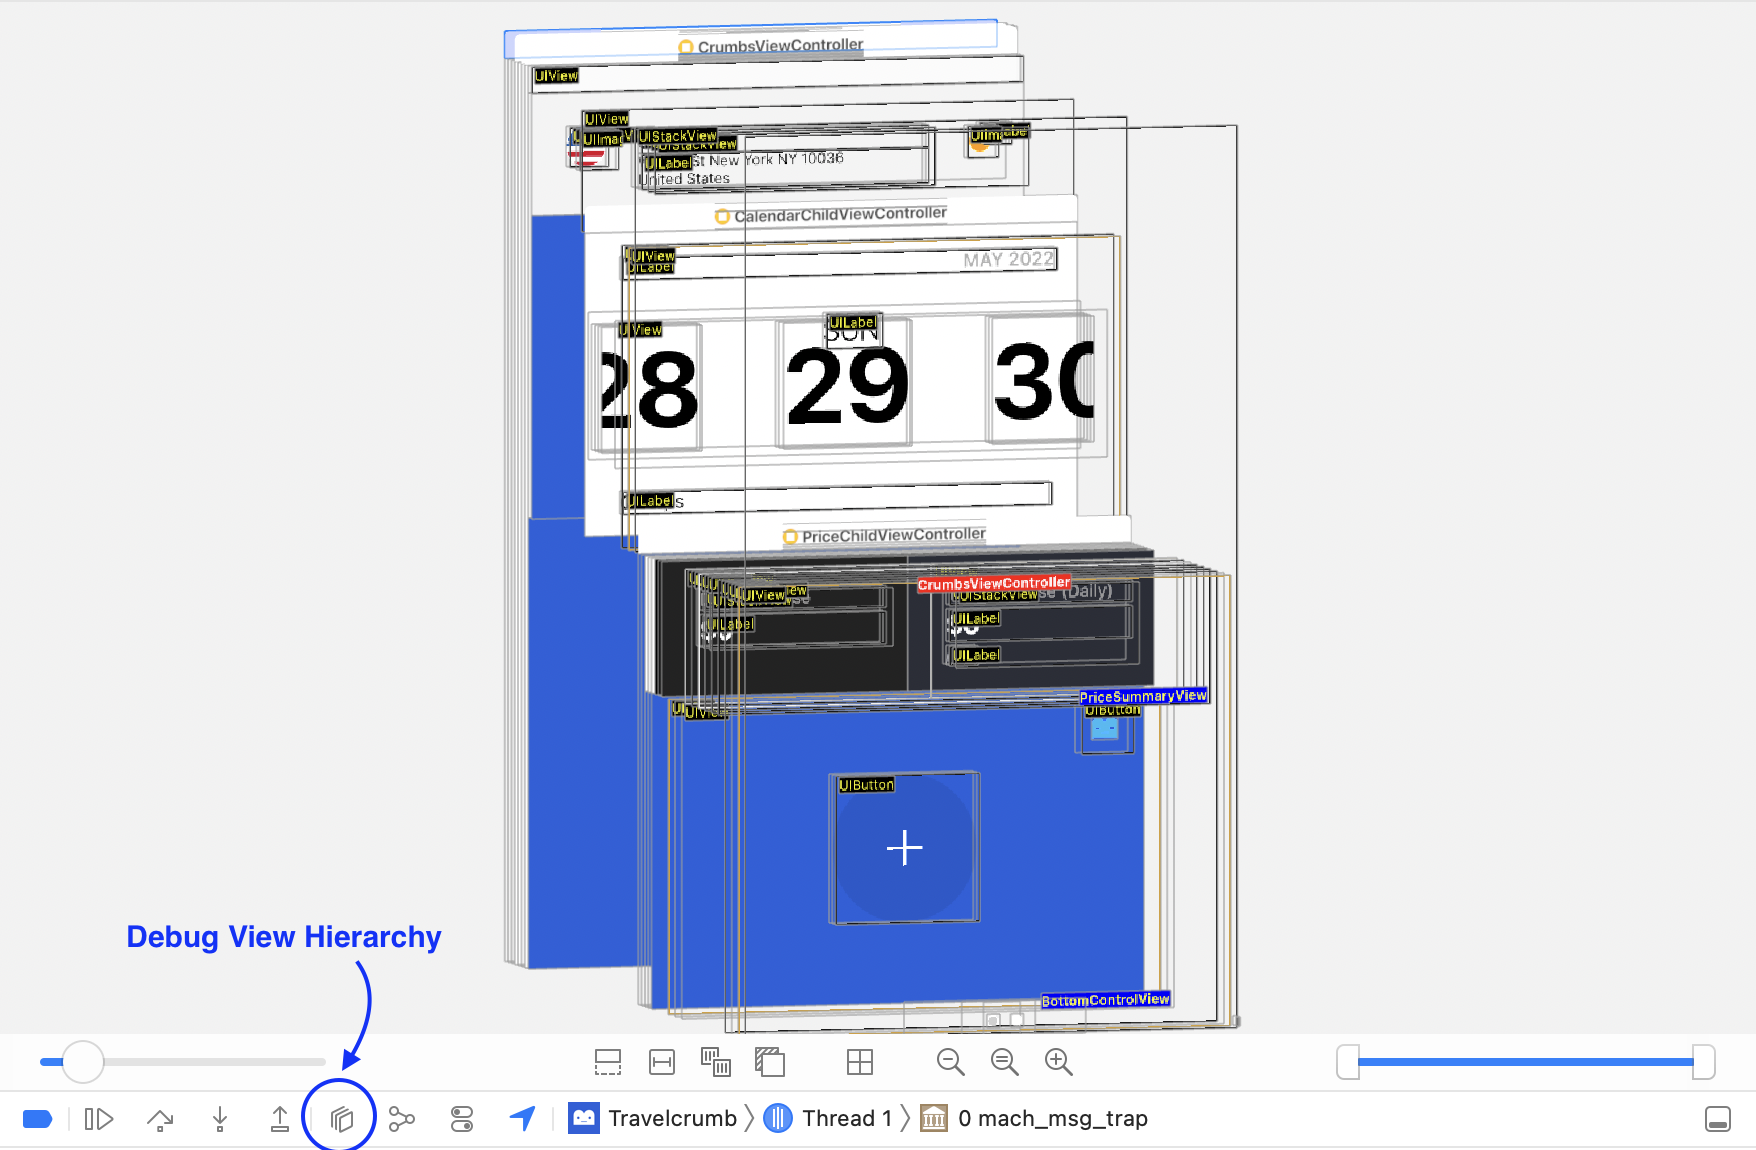
 debug view

Demo

XRay.mp4

How to Use

Use XRay in Debug mode only. I don't recommend using it with Swizzling function.

  1. Add XRay in your project

Screen Shot 2022-05-29 at 1 17 41 PM

  1. Set ScreenShot Notification (AppDelegate.swift)
func application(_ application: UIApplication, didFinishLaunchingWithOptions launchOptions: [UIApplication.LaunchOptionsKey: Any]?) -> Bool {
        // Override point for customization after application launch.
    #if DEBUG
        NotificationCenter.default.addObserver(
            self, selector: #selector(screenshotTaken),
            name: UIApplication.userDidTakeScreenshotNotification, object: nil
        )
    #endif
        return true
    }
    #if DEBUG
    @objc func screenshotTaken() {
        guard let scene = UIApplication.shared.connectedScenes.first as? UIWindowScene,
                let keyWindow = scene.keyWindow,
                let topViewController = keyWindow.topViewController() else {
            return
        }
        let xray = XRay(rootViewController: topViewController)
        xray.captureXray(classNameOption: .all)
        DispatchQueue.main.asyncAfter(deadline: .now() + .seconds(5)) {
            xray.removeXray()
        }
    }
    #endif

ClassNameOption

func captureXray(classNameOption: ClassNameOption)
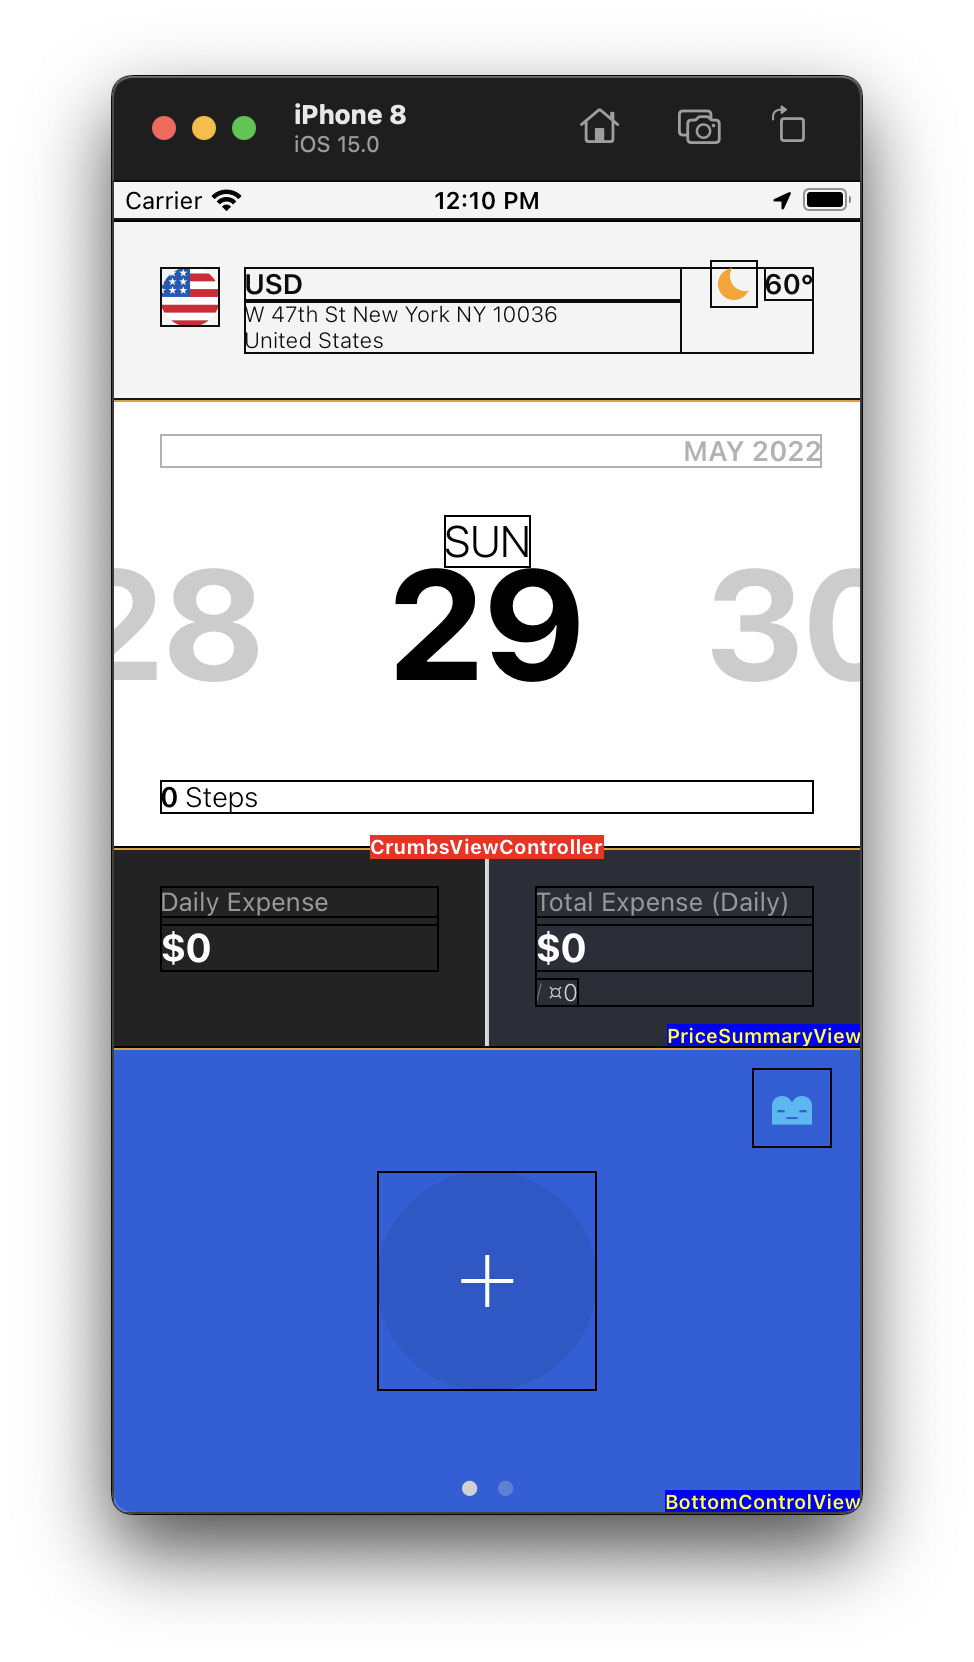
Labels

  • Red Label(Center): ViewController
  • Blue Label(trailing bottom): Custom View
  • Black Label(leading top): View

ClassNameOption.all

This option shows all of the view hierarchies.

ClassNameOption.customClass

This option shows custom view only

Reference

You might also like...
A collection of tools for debugging, diffing, and testing your application's data structures.

Custom Dump A collection of tools for debugging, diffing, and testing your application's data structures. Motivation customDump diff XCTAssertNoDiffer

Automaticly display Log,Crash,Network,ANR,Leak,CPU,RAM,FPS,NetFlow,Folder and etc with one line of code based on Swift. Just like God opened his eyes

GodEye Automaticly display Log,Crash,Network,ANR,Leak,CPU,RAM,FPS,NetFlow,Folder and etc with one line of code based on Swift. Just like God opened hi

📘A library for isolated developing UI components and automatically taking snapshots of them.

A library for isolated developing UI components and automatically taking snapshots of them. Playbook Playbook is a library that provides a sandbox for

A lightweight, one line setup, iOS / OSX network debugging library! 🦊

Netfox provides a quick look on all executed network requests performed by your iOS or OSX app. It grabs all requests - of course yours, requests from

Set of easy to use debugging tools for iOS developers & QA engineers.

DBDebugToolkit DBDebugToolkit is a debugging library written in Objective-C. It is meant to provide as many easily accessible tools as possible while

Chisel is a collection of LLDB commands to assist debugging iOS apps.

Chisel Chisel is a collection of LLDB commands to assist in the debugging of iOS apps. [Installation • Commands • Custom Commands • Development Workfl

Next generation debugging framework for iOS

Alpha is the idea of a next generation debugging framework for iOS applications. It combines multiple debugging tools built on top of a simple, unifie

Customizable Console UI overlay with debug log on top of your iOS App

AEConsole Customizable Console UI overlay with debug log on top of your iOS App AEConsole is built on top of AELog, so you should probably see that fi

a iOS network debug library, monitor HTTP requests

NetworkEye README 中文 NetworkEye,a iOS network debug library,monitor HTTP requests. It can be detected HTTP request include web pages, NSURLConnection,

Releases(1.0.2)
Owner
Shawn Baek
Senior iOS Developer. In my spare time, I travel the world.
Shawn Baek
Dotzu In-App iOS Debugging Tool With Enhanced Logging, Networking Info, Crash reporting And More.

Dotzu In-App iOS Debugging Tool With Enhanced Logging, Networking Info, Crash reporting And More. The debugger tool for iOS developer. Display logs, n

Remi ROBERT 1.8k Jan 3, 2023
Tool to debug layouts directly on iOS devices: inspect layers in 3D and debug each visible view attributes

Introduction Features Inspect layouts directly on iOS devices Inspection could be triggered only if app is running under DEBUG build configuration, so

Ihor Savynskyi 510 Dec 24, 2022
In-app design review tool to inspect measurements, attributes, and animations.

Hyperion Hyperion - In App Design Review Tool What is it? Hyperion is a hidden plugin drawer that can easily be integrated into any app. The drawer si

WillowTree, LLC 2k Dec 27, 2022
Network debugging made easy,This network debugging tool is developed based on the swift version of Wormholy.

Start debugging iOS network calls like a wizard, without extra code! Wormholy makes debugging quick and reliable. What you can do: No code to write an

null 21 Dec 14, 2022
Free macOS app for iOS view debugging.

Introduction You can inspect and modify views in iOS app via Lookin, just like UI Inspector in Xcode, or another app called Reveal. Official Website:h

Li Kai 575 Dec 28, 2022
Demonstrates a memory leak bug SwiftUI's toolbar APIs exhibit on macOS

Mac SwiftUI Toolbar Memory Leak Demo On Big Sur (macOS 11), SwiftUI's APIs for adding toolbar items to a window have (at least) two bugs around view r

Matt Curtis 6 Aug 6, 2022
TouchInspector - a lightweight package that helps you visualize and debug touches on iOS and iPadOS

TouchInspector is a lightweight package that helps you visualize and debug touches on iOS and iPadOS.

Janum Trivedi 116 Jan 3, 2023
In-app console and debug tools for iOS developers

LocalConsole Welcome to LocalConsole! This Swift Package makes on-device debugging easy with a convenient PiP-style console that can display items in

Duraid Abdul 650 Jan 1, 2023
Remote network and data debugging for your native iOS app using Chrome Developer Tools

PonyDebugger PonyDebugger is a remote debugging toolset. It is a client library and gateway server combination that uses Chrome Developer Tools on you

Square 5.9k Dec 24, 2022
A little and powerful iOS framework for intercepting HTTP/HTTPS Traffic.

A little and powerful iOS framework for intercepting HTTP/HTTPS Traffic from your app. No more messing around with proxy, certificate config. Features

Proxyman 874 Jan 6, 2023