Beautiful charts for iOS/tvOS/OSX! The Apple side of the crossplatform MPAndroidChart.

Related tags

Charts Charts
Overview

Version 4.0.0, synced to MPAndroidChart #f6a398b

alt tag Supported Platforms Releases Latest pod release Carthage compatible Build Status codecov Join the chat at https://gitter.im/danielgindi/Charts

Just a heads up: Charts 3.0 has some breaking changes. Please read the release/migration notes.

Another heads up: ChartsRealm is now in a separate repo. Pods is also now Charts and ChartsRealm, instead of Charts/Core and Charts/Realm

One more heads up: As Swift evolves, if you are not using the latest Swift compiler, you shouldn't check out the master branch. Instead, you should go to the release page and pick up whatever suits you.

  • Xcode 11 / Swift 5 (master branch)
  • iOS >= 8.0 (Use as an Embedded Framework)
  • tvOS >= 9.0
  • macOS >= 10.11

Okay so there's this beautiful library called MPAndroidChart by Philipp Jahoda which has become very popular amongst Android developers, but there was no decent solution to create charts for iOS.

I've chosen to write it in Swift as it can be highly optimized by the compiler, and can be used in both Swift and ObjC project. The demo project is written in ObjC to demonstrate how it works.

An amazing feature of this library now, for Android, iOS, tvOS and macOS, is the time it saves you when developing for both platforms, as the learning curve is singleton- it happens only once, and the code stays very similar so developers don't have to go around and re-invent the app to produce the same output with a different library. (And that's not even considering the fact that there's not really another good choice out there currently...)

Having trouble running the demo?

  • ChartsDemo/ChartsDemo.xcodeproj is the demo project for iOS/tvOS
  • ChartsDemo-OSX/ChartsDemo-OSX.xcodeproj is the demo project for macOS
  • Make sure you are running a supported version of Xcode.
    • Usually it is specified here a few lines above.
    • In most cases it will be the latest Xcode version.
  • Make sure that your project supports Swift 5.0
  • Optional: Run carthage checkout in the project folder, to fetch dependencies (i.e testing dependencies).
    • If you don't have Carthage - you can get it here.

Usage

In order to correctly compile:

  1. Drag the Charts.xcodeproj to your project
  2. Go to your target's settings, hit the "+" under the "Embedded Binaries" section, and select the Charts.framework
  3. @import Charts
  4. When using Swift in an ObjC project:
  • You need to import your Bridging Header. Usually it is "YourProject-Swift.h", so in ChartsDemo it's "ChartsDemo-Swift.h". Do not try to actually include "ChartsDemo-Swift.h" in your project :-)
  • (Xcode 8.1 and earlier) Under "Build Options", mark "Embedded Content Contains Swift Code"
  • (Xcode 8.2+) Under "Build Options", mark "Always Embed Swift Standard Libraries"
  1. When using Realm.io:
    • Note that the Realm framework is not linked with Charts - it is only there for optional bindings. Which means that you need to have the framework in your project, and in a compatible version to whatever is compiled with Charts. We will do our best to always compile against the latest version.
    • You'll need to add ChartsRealm as a dependency too.

3rd party tutorials

Video tutorials

Blog posts

Want your tutorial to show here? Create a PR!

Troubleshooting

Can't compile?

  • Please note the difference between installing a compiled framework from CocoaPods or Carthage, and copying the source code.
  • Please read the Usage section again.
  • Search in the issues
  • Try to politely ask in the issues section

Other problems / feature requests

  • Search in the issues
  • Try to politely ask in the issues section

CocoaPods Install

Add pod 'Charts' to your Podfile. "Charts" is the name of the library.
For Realm support, please add pod 'ChartsRealm' too.

Note: pod 'ios-charts' is not the correct library, and refers to a different project by someone else.

Carthage Install

Charts now include Carthage prebuilt binaries.

4.0.0 ">
github "danielgindi/Charts" == 4.0.0
github "danielgindi/Charts" ~> 4.0.0

In order to build the binaries for a new release, use carthage build --no-skip-current && carthage archive Charts.

Swift Package Manager Install

Swift Package Manager

dependencies: [
    .package(url: "https://github.com/danielgindi/Charts.git", .upToNextMajor(from: "4.0.0"))
]

3rd party bindings

Xamarin (by @Flash3001): iOS - GitHub/NuGet. Android - GitHub/NuGet.

Help

If you like what you see here, and want to support the work being done in this repository, you could:

  • Contribute code, issues and pull requests
  • Let people know this library exists ( 🔥 spread the word 🔥 )
  • Donate (You can buy me a beer, or you can buy me dinner :-)

Note: The author of MPAndroidChart is the reason that this library exists, and is accepting donations on his page. He deserves them!

Questions & Issues

If you are having questions or problems, you should:

  • Make sure you are using the latest version of the library. Check the release-section.
  • Study the Android version's Documentation-Wiki
  • Study the (Still incomplete Doc-Percent) Pod-Documentation
  • Search or open questions on stackoverflow with the ios-charts tag
  • Search known issues for your problem (open and closed)
  • Create new issues (please 🔥 search known issues before 🔥 , do not create duplicate issues)

Features

Core features:

  • 8 different chart types
  • Scaling on both axes (with touch-gesture, axes separately or pinch-zoom)
  • Dragging / Panning (with touch-gesture)
  • Combined-Charts (line-, bar-, scatter-, candle-stick-, bubble-)
  • Dual (separate) Axes
  • Customizable Axes (both x- and y-axis)
  • Highlighting values (with customizable popup-views)
  • Save chart to camera-roll / export to PNG/JPEG
  • Predefined color templates
  • Legends (generated automatically, customizable)
  • Animations (build up animations, on both x- and y-axis)
  • Limit lines (providing additional information, maximums, ...)
  • Fully customizable (paints, typefaces, legends, colors, background, gestures, dashed lines, ...)
  • Plotting data directly from Realm.io mobile database (here)

Chart types:

Screenshots are currently taken from the original repository, as they render exactly the same :-)

  • LineChart (with legend, simple design) alt tag

  • LineChart (with legend, simple design) alt tag

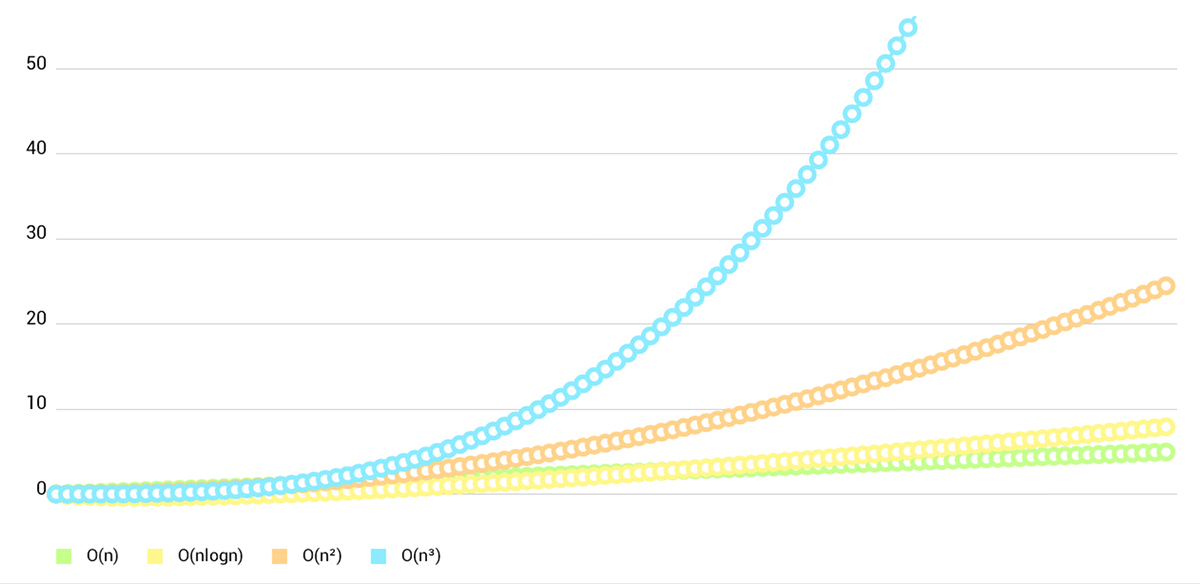
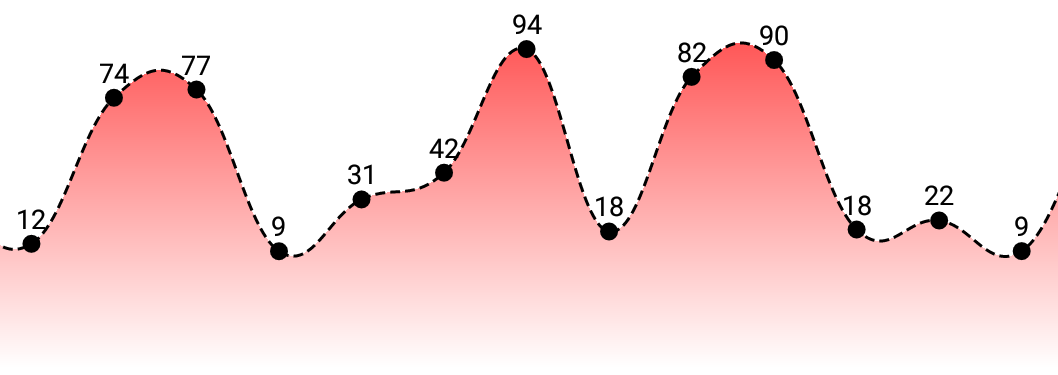
  • LineChart (cubic lines) alt tag

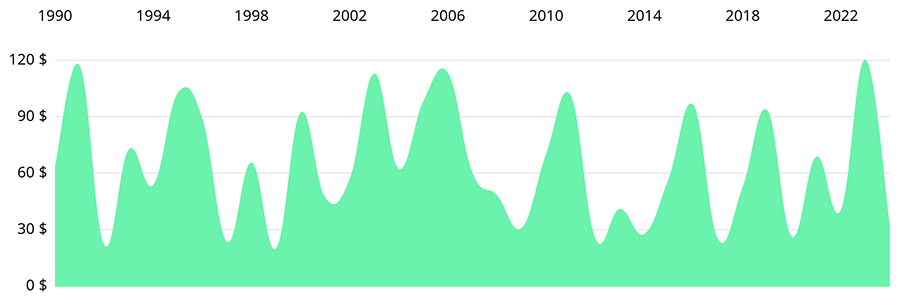
  • LineChart (gradient fill) alt tag

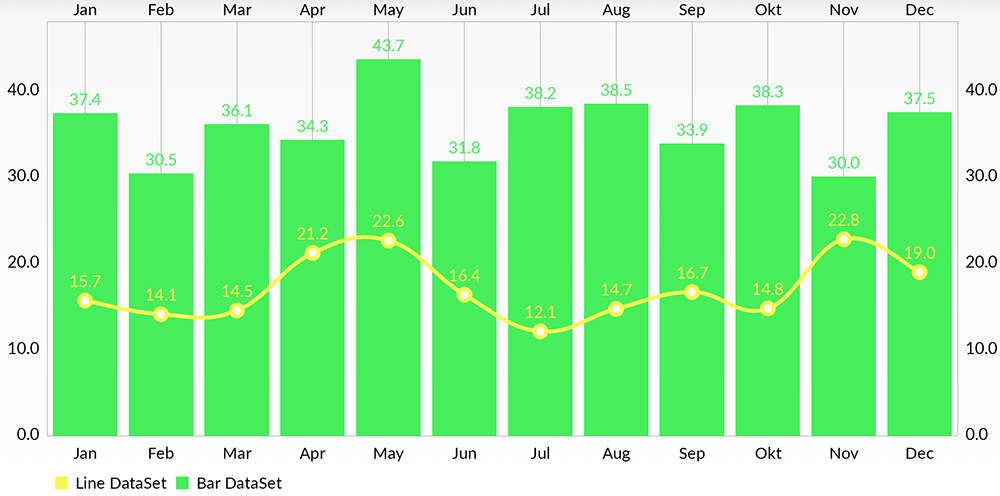
  • Combined-Chart (bar- and linechart in this case) alt tag

  • BarChart (with legend, simple design)

alt tag

  • BarChart (grouped DataSets)

alt tag

  • Horizontal-BarChart

alt tag

  • PieChart (with selection, ...)

alt tag

  • ScatterChart (with squares, triangles, circles, ... and more)

alt tag

  • CandleStickChart (for financial data)

alt tag

  • BubbleChart (area covered by bubbles indicates the value)

alt tag

  • RadarChart (spider web chart)

alt tag

Documentation

Currently there's no need for documentation for the iOS/tvOS/macOS version, as the API is 95% the same as on Android.
You can read the official MPAndroidChart documentation here: Wiki

Or you can see the Charts Demo project in both Objective-C and Swift (ChartsDemo-iOS, as well as macOS ChartsDemo-macOS) and learn the how-tos from it.

Special Thanks

Goes to @liuxuan30, @petester42 and @AlBirdie for new features, bugfixes, and lots and lots of involvement in our open-sourced community! You guys are a huge help to all of those coming here with questions and issues, and I couldn't respond to all of those without you.

Our amazing sponsors

Debricked: Use open source securely

debricked

License

Copyright 2016 Daniel Cohen Gindi & Philipp Jahoda

Licensed under the Apache License, Version 2.0 (the "License"); you may not use this file except in compliance with the License. You may obtain a copy of the License at

http://www.apache.org/licenses/LICENSE-2.0

Unless required by applicable law or agreed to in writing, software distributed under the License is distributed on an "AS IS" BASIS, WITHOUT WARRANTIES OR CONDITIONS OF ANY KIND, either express or implied. See the License for the specific language governing permissions and limitations under the License.

Comments
  • ************* Migrating to Charts 3.0 ********************

    ************* Migrating to Charts 3.0 ********************

    Many have asked about how to migrate to Charts 3.0. So everything will be in the release notes soon as there will be a release, but I will write those down here for now:


    This is a major release, with a few breaking changes. So please pay attention.

    Updates:

    • x-indexes are dead. Intoducing: x-values. Each entry now has an x and a y.
    • Pie/radar charts do not have a concept of X index anymore
    • Unified XAxis/YAxis features and experience.
    • Unified formatter interfaces for axes.
    • New formatter for y values, not inheriting from NSNumberFormatter anymore, to have dataSet and viewport information to take better formatting decisions.
    • Major refactoring of the Highlight mechanism.
    • Refactored marker mechanism
    • Refactored legend entry mechanism
    • Each dataset can now set its own legend form/size/etc.
    • More demos
    • Some classes have been renamed, keeping the namespaced name only in ObjC (using Swift 2.2 objc(...) feature, and the change of a major version update)
    • FillFormatter now has a block representation using FillFormatter.withblock(...)
    • Same goes for all Default formatters too.
    • No more saveToCameraRoll(). Since Xcode 8.0 it causes "privacy" issues with Apple Review, you have to add the photo albums privacy key to your Info.plist for that.
    • Moved to Swift 3.0. Make sure your project conforms to Swift 3.0.
    • Many minor bug fixes and improvements

    Breaking changes / how to migrate:

    • All dataset constructors have changed - they do not take an array of x-indices anymore.
    • All entry constructors have changed - they take in an X and a Y.
    • Pie and Radar chart entries now have their own classes. So exchange the Entry classes withPieChartDataEntry/RadarChartDataEntry
    • If you have any old startAtZeroEnabled calls - these have been deprecated for a long time. Replace them with axisMinimum.
    • If you are using formatters:
      • Replace any chart.valueFormatter = formatter with chart.valueFormatter = ChartDefaultValueFormatter(formatter: formatter) or chart.valueFormatter = [[ChartDefaultValueFormatter alloc] initWithFormatter:formatter];
      • Replace any axis.valueFormatter = formatter with axis.valueFormatter = ChartDefaultAxisValueFormatter(formatter: formatter) or axis.valueFormatter = [[ChartDefaultAxisValueFormatter alloc] initWithFormatter:formatter];
    • In general, all functions that accepted x-indices before, now accept an x-value, so you might have to adjust the names a little bit.
    • Where ChartViewDelegate is implemented, update the chartValueSelected interface
    • Replace drawSliceTextEnabled with drawEntryLabelsEnabled
    • If you have a custom scatter shape - implement an IShapeRenderer, and put your rendering code in there
    • If you have a custom marker - consider subclassing MarkerView/MarkerImage or implementing IMarker. There are more options than before now...
    • If you have used barSpace before, move to using barWidth
    • If you used saveToCameraRoll(), replace with UIImageWriteToSavedPhotosAlbum(chart.getChartImage(trasparent: false), nil, nil, nil)
    • Some classes have been renamed for a cleaner look. They do not contain the "Chart" prefix anymore. That's for Swift only, where there are namespaces. In ObjC the names stayed the same for the sake of namespacing, using Swift 2.2's feature of @objc(name). If your compiler yells that a class does not exist, try to remove the Chart from its name. This should rarely happen, as we've chosen only the classes that are rarely instantiated by the user.
    opened by danielgindi 61
  • Swift 2.3 & 3.0 support: news, issues, PRs and state

    Swift 2.3 & 3.0 support: news, issues, PRs and state

    Using this thread to list the current news, issues, PRs, and state for swift 3.0 support. This post will be updated accordingly.

    As Xcode beta 4 comes out, there are even more changes(#1290), seems it's much easier to convert the library after swift 3.0 released once and for all, than continuous merging from beta 1 to beta N and finally merge into master.

    Xcode beta 6 has even more changes based on beta 4.. But thanks to @acegreen, we now on beta 6 now.

    Therefore, I am thinking the current Swift 2.3 and 3.0 branches are just for everyone to test their apps with iOS 10 beta. Thanks for everyone who commits into 2.3 and 3.0 branch.

    What branch to use?

    Swift 3.0 + Charts 3.0 -> Master // this is recommended to pick :)

    Swift 2.3 + Charts 2.2.5 -> Chart2.2.5-Swift2.3 branch Swift 3.0 + Charts 2.2.5 -> Chart2.2.5-Swift3.0 branch Swift 2.3 + Charts 3.0 feature ready -> Chart3.0-Swift2.3 branch

    Progress

    Master branch has migrated to Swift 3.0 and Chart 3.0 and this is the branch will get bug fix and new features. Other temp branches will be deleted once it's stable. Those branches are just for people to pick whatever the need to use in their project for upgrading Xcode 8, however they are not maintained, or at least only small bug fixes for Swift will kick in. Any bugs that are Chart 2.2.5 specific won't be fixed in these temp branches.

    Swift-3.0 branch is based on Charts 2.2.5; has some fixes for OS X demo on Xcode 8 GM Swift-2.3 branch is sync with master(Chart v3.0 feature ready) 5e020a8f8489a8c71c2387f3334aab5fb64f2fe3 for iOS 10/macOS + Charts 3.0 on Xcode beta 6, works fine on Xcode 8 GM Chart2.2.5-Swift2.3 branch is based on Chart 2.2.5 release and converted to Swift 2.3 on Xcode beta 6 works fine on Xcode 8 GM

    Open issues (up to Xcode 8 GM):

    #1421 linear line chart has additional line segments wile zooming in (PR #1420) #1269: Realm swift 3.0 support is blocked due to Xcode 8 beta 3 & 4 swift compiler bug

    This seems a compiler bug pending to fix. Anyone relies one Realm have to wait until this bug has been fixed. Please use Swift 2.3 to test iOS 10. Now, the code is ready (PR #1414), but pending a swift 3 Realm framework to test. #1171: I found this PR removed isDrawValuesEnabled and other similar protocol methods prefixed with 'is', that's why #1295 is removing 'is' from the function name... Watch out

    function inconsistency:

    Seeing different signatures for same API on macOS and iOS, such as:

    NSFont: class func systemFontSize() UIFont: class var systemFontSize: CGFloat { get }

    NSParagraphStyle

    NSParagraphStyle: on macOS, it's: class func default() -> NSParagraphStyle on iOS, it's: class var default: NSParagraphStyle { get }

    I have filed a bug 27731357 on radar. If they intended to do so, we have to wrap it.. again

    Pull requests:

    Swift 3.0

    #1414 is merged for Realm extension issue, still need Realm to release Swift 3.0 branch to make the framework compile. #1378 is merged for migrating public to open (SE-1107) #1342 is meged for Xcode beta 6 #1294, #1295 is merged for Xcode beta 4, including project settings, ChartsRealm, ChartsDemo

    If you remove all Realm related files and code, you should be able to launch ChartsDemo with Xcode beta 4 now. #1290 is merged for Xcode beta 4 #1266 is merged via #1296 due to conflicts (RunLoopMode changes)

    Swift 2.3

    #1389 is merged for Xcode beta 6 + Charts v3.0 code in master, at 5e020a8f8489a8c71c2387f3334aab5fb64f2fe3 #1281 is merged for Xcode beta 4

    discussion a work in progress 
    opened by liuxuan30 60
  • Making X-Values Properly Scaled (Not Equidistant)

    Making X-Values Properly Scaled (Not Equidistant)

    Hi, I'm making a line chart with the following example data points:

    (0,0) (1,0) (5,0)

    Is there a way I can get the 3 points to show up so that they're scaled properly? Right now, if I add a Data Set with 2 arrays, all 3 points are the same distance from each other. I know there's a thread about this in MPAndroidCharts, but I was wondering if anyone's figured out how to do this in iOS. Thank you so much!

    feature â˜…★★ 
    opened by ghost 59
  • Stop axis labels duplicating.

    Stop axis labels duplicating.

    Within the App I have an issue where the labels on the left axis of either a BarChartView or a LineChartView repeats.

    I first added the snippet below to ensure that the number of labels on the axis does not exceed the maximum value in the y data.

    self.chartView.leftAxis.labelCount = self.chartView.data.yMax > YAxisMaxLabelCount ? YAxisMaxLabelCount : self.chartView.data.yMax;
    

    This ensured that if the maximum value in the y data was 3 then there would only be 3 labels within the axis. Now this worked fine if the graph was not interactive, i.e. the user could not zoom the chart.

    As soon as the user zooms obviously the count of the labels remains the same and the value formatter fills in the gaps allowing a value to repeat.

    Example of axis with no duplicated values screen shot 2015-08-24 at 5 07 29 pm

    Example of same chart but zoomed in screen shot 2015-08-24 at 5 07 54 pm

    The screenshots show the left axis repeating the value 2. What is your best suggestion on solving this repeating label issue? Any help would be grateful. If you need any further information let me know.

    Thanks

    opened by steprescott 52
  • Add support for rounded corners for BarChart

    Add support for rounded corners for BarChart

    Issue Link :link:

    Rounding the corners of bars #1066

    Goals :soccer:

    image

    • Add ability to draw rounded corners for BarChartView and HorizontalBarChartView.
    • Support also stacked bar charts.
    • Corner radius should be calculated automatically, depending on chart's width and height.
    • To use it simply add dataSet.roundedCorners = [.allCorners].

    Implementation Details :construction:

    • Add roundedCorners property for BarChartDataSet, where you can specify which corners should be rounded.
    • Introduce changes in drawDataSet function in BarChartRenderer and HorizontalBarChartRenderer, where UIBezierPath is created to clip bar filling.
    • Similar changes apply to drawHighlighted function in BarChartRenderer.

    Testing Details :mag:

    Add testRoundedCorners test to BarChartTests.

    opened by skarol 51
  • Fatal error: Can't form Range with upperBound < lowerBound

    Fatal error: Can't form Range with upperBound < lowerBound

    hey @danielgindi , first of all, thanks for the awesome library. I have recently updated the library and a crash is occurring in "extension BarLineScatterCandleBubbleRenderer.XBounds: Sequence" in constructor. line is

    fileprivate init(min: Int, max: Int) { -----> self.iterator = (min...max).makeIterator() }

    Can you please tell me, why is it crashing and what am I doing wrong and how can I prevent it? Its astonishing that graphs have been working fine on previous versions of library.

    Error on xcode debugger is: Fatal error: Can't form Range with upperBound < lowerBound

    bug 
    opened by danishnaeem57 40
  • Crash building iterator. Range requires lowerBound <= upperBound

    Crash building iterator. Range requires lowerBound <= upperBound

    What did you do?

    Upgrade from 3.6.0 to 4.0.2

    What happened ?

    Most drawing of charts leads to a crash when building iterator in extension BarLineScatterCandleBubbleRenderer.XBounds: Sequence because Range requires lowerBound <= upperBound

    let entryTo = dataSet.entryForXValue(high, closestToY: .nan, rounding: .up) is nil. It looks like the closest found is < endIndex in the dataset.

    I use custom minimum and maximum axis values and visible range.

    The same code was working perfectly in v3.6. I also tried to rollback to 3.6 as a temporary workaround but the project doesn't compile anymore with XCode 13.3.

    Charts Environment

    Charts version/Branch/Commit Number: 4.0.2 Xcode version: 13.3 (13E113) Swift version: 5 Platform(s) running Charts: iOS macOS version running Xcode: 12.0.1 (21A559)

    opened by sebastienhannay 37
  • <Error>: CGAffineTransformInvert: singular matrix

    : CGAffineTransformInvert: singular matrix

    I am getting this error repeatedly with a HorizontalBarChartView: <Error>: CGAffineTransformInvert: singular matrix.

    There is nothing special about my code. I am using a HorizontalBarChartView in OSX that is 175x394 points in size. It is not obstructed by any other views. I initialize the chart with:

    @IBOutlet weak var horizontalBarChart: HorizontalBarChartView!
    let data = BarChartData(xVals: [1.0, 3.0, 5.0, 7.0, 8.0])
    horizontalBarChart.data = data
    horizontalBarChart.notifyDataSetChanged()
    

    and then get hit with the error multiple times a second. Any idea what is causing this?

    Line 206 in ChartTransformer is the only place the CGAffineTransformInvert is called.

    bug 
    opened by klanderson 36
  • Grouped columns misplaced

    Grouped columns misplaced

    Hey, I'm having troubles with grouped bar chart. My barChartData are following:

    x-values (array of dates): 02.júla.15, 23.júla.15, 24.júla.15

    dataSets: ChartDataSet, label: tst, 1 entries: ChartDataEntry, xIndex: 0, value 0.0, ChartDataSet, label: tst, 1 entries: ChartDataEntry, xIndex: 0, value 0.0, ChartDataSet, label: tst, 1 entries: ChartDataEntry, xIndex: 0, value 0.0, ChartDataSet, label: tst, 1 entries: ChartDataEntry, xIndex: 0, value 0.0, ChartDataSet, label: tst, 1 entries: ChartDataEntry, xIndex: 0, value 0.0, ChartDataSet, label: tst, 1 entries: ChartDataEntry, xIndex: 1, value 39.0, ChartDataSet, label: tst, 1 entries: ChartDataEntry, xIndex: 2, value 16.0, ChartDataSet, label: tst, 1 entries: ChartDataEntry, xIndex: 2, value 28.0

    This produces almost correct result, however bars seems to have wrong position as showed in this image http://imgur.com/Vq43QFH

    What am I doing wrong? :)

    opened by JanciP 34
  • Support for Xcode 14

    Support for Xcode 14

    What did you do?

    Build the project with Xcode 14 Beta 3

    What did you expect to happen?

    For the project to successfully build.

    What happened instead?

    There are 2 types of build errors

    1. Build error around CandleStickChartRenderer's and RadarChartRenderer's drawData(context: CGContext) where the IndexingIterator are not equivalent. Raw message:

    error build: Referencing instance method 'makeIterator()' on 'Collection' requires the types 'IndexingIterator' and 'IndexingIterator' be equivalent

    1. Build error around ChartDataSet not conforming to RangeReplaceableCollection as replaceSubrange(_:with:) is missing. Raw messages:

    error build: Type 'ChartDataSet' does not conform to protocol 'RangeReplaceableCollection'

    error build: Unavailable instance method 'replaceSubrange(_:with:)' was used to satisfy a requirement of protocol 'RangeReplaceableCollection'

    Charts Environment

    Charts version/Branch/Commit Number: 4.0.3 Xcode version: Xcode 14 Beta 3 (14A5270f) Swift version: 5.7 Platform(s) running Charts: iOS macOS version running Xcode: 12.4 (21F79)

    opened by lukelabonte 33
  • dyld: Library not loaded: @rpath/Charts.framework/Charts XCODE 11.3.1

    dyld: Library not loaded: @rpath/Charts.framework/Charts XCODE 11.3.1

    What did you do?

    ℹ I built my app on my physical iphone and put my computer to sleep. When I got back, without making ABSOLUTELY NO changes I built the app once more (clicked the "play" button on XCODE) and ever since I've been getting the error:

    dyld: Library not loaded: @rpath/Charts.framework/Charts Referenced from: /private/var/containers/Bundle/Application/4B33D98E-3CC3-4632-8164-49F7465AFD92/Test.app/Test Reason: no suitable image found. Did find: /private/var/containers/Bundle/Application/4B33D98E-3CC3-4632-8164-49F7465AFD92/Test.app/Frameworks/Charts.framework/Charts: code signature invalid for '/private/var/containers/Bundle/Application/4B33D98E-3CC3-4632-8164-49F7465AFD92/Test.app/Frameworks/Charts.framework/Charts'

    /private/var/containers/Bundle/Application/4B33D98E-3CC3-4632-8164-49F7465AFD92/Test.app/Frameworks/Charts.framework/Charts: stat() failed with errno=25
    /private/var/containers/Bundle/Application/4B33D98E-3CC3-4632-8164-49F7465AFD92/Test.app/Frameworks/Charts.framework/Charts: code signature invalid for '/private/var/containers/Bundle/Application/4B33D98E-3CC3-4632-8164-49F7465AFD92/Test.app/Frameworks/Charts.framework/Charts'
    
    /private/var/containers/Bundle/Application/4B33D98E-3CC3-4632-8164-49F7465AFD92/Test.app/Frameworks/Charts.framework/Charts: stat() failed with errno=1
    /pri(lldb) 
    

    Charts Environment

    Xcode version: 11.3.1 Swift version: 5something

    opened by CypriotUnknown 33
  • fix ChartViewBase.data assgin bug

    fix ChartViewBase.data assgin bug

    Issue Link :link:

    If I call ChartData setValueFormatter:DefaultValueFormatter func before I call ChartView data assign(chartView.data = data), the valueFormatter won't work. Here is issue code....

    let pFormatter = NumberFormatter()
    pFormatter.numberStyle = .percent
    pFormatter.maximumFractionDigits = 2
    pFormatter.multiplier = 1
    pFormatter.percentSymbol = "%"
    data.setValueFont(.systemFont(ofSize: 11, weight: .light))
    data.setValueTextColor(.black)
    data.setValueFormatter(DefaultValueFormatter(formatter: pFormatter))
    chartView.data = data
    

    Goals :soccer:

    None

    Implementation Details :construction:

    None

    Testing Details :mag:

    Just test for myself project.

    opened by UnivexDont 0
  • Background color for label on right axis of linechart

    Background color for label on right axis of linechart

    How to change the background color of label on rightAxis of LineChartView. I want to give it background color and make it rounded. I am able to change the LabelTextColor.

    opened by oxnnj 0
  • Assertion Error after an Upgrade to XCode Version 14.2  and Charts Master

    Assertion Error after an Upgrade to XCode Version 14.2 and Charts Master

    ℹ Please fill out this template when filing an issue. All lines beginning with an ℹ symbol instruct you with what info we expect. You can delete those lines once you've filled in the info.

    Per our *CONTRIBUTING guidelines, we use GitHub for bugs and feature requests, not general support. Other issues should be opened on Stack Overflow with the tag ios-charts.

    Please remove this line and everything above it before submitting.

    What did you do?

    Upgraded XCode to Version 14.2 from 13 and Charts to branch->Master from older version 3.6

    What did you expect to happen?

    I expected my app to run without any error and show chart as it was doing before these upgrades

    What happened instead?

    XCode project was built successfully after I made some code changes as per #4860 (and made few other minor changes like changing addDataSet to append) However, after the build, the simulator gets stuck and XCode throws following error after launching

    Assertion failed: removeAll(keepingCapacity:) not supported for CombinedData

    Error at :
    Script: ChartData.swift function: removeAll LOC: assert(!(self is CombinedChartData), "(#function) not supported for CombinedData")

    Charts Environment

    **Charts version/Branch/Commit Number: Branch Master **Xcode version: 14.2 **Swift version: Swift 5 **Platform(s) running Charts: XCode Simulator iPhone 14 pro (iOS 16.2) **macOS version running Xcode: Ventura version 13.1 (22C65)

    Demo Project

    ℹ Please link to or upload a project we can download that reproduces the issue.

    opened by KumarRupesh 0
  • How to store Chart data and reload it when app is relaunched ?

    How to store Chart data and reload it when app is relaunched ?

    Hi,

    since I am new to the swift language, please forgive me if my question is not making sense. I used the Chart module to draw line charts for my live data from the pressure sensor, It's working great but when my app is killed and relaunched again all the data is gone.

    Please help me to go through this issue, thanks in advance!

    opened by Laihu08 0
  • How to pass [String : Double] dictionary data into line chart in Swift?

    How to pass [String : Double] dictionary data into line chart in Swift?

    Hi i have a currency exchange API returning the rates for selected currencies in specified date range ( in my case 10 days) . Ä°t returns the dates as String and rates as double inside a dictionary. How can I pass these dates in x axis and rates in y axis?

    opened by bgomiss 0
  • XAxisRenderer crash: Index out of range

    XAxisRenderer crash: Index out of range

    I've got an index out-of-range crash in the method drawLabels of XAxisRenderer class Screenshot 2022-12-25 at 08 30 21 This crash happens only if I set centerAxisLabelsEnabled to true for xAxis of my chart. I believe that the reason for this crash is in this line: Screenshot 2022-12-25 at 08 55 33 With this code, the number of centered entries is always less by one compared to the axis.entries Screenshot 2022-12-25 at 10 11 01

    If I remove this [..<n] part the crash doesn't happen again

    opened by ruslankuksa 0
Releases(v4.1.0)
  • v4.1.0(Sep 13, 2022)

    What's Changed

    • Update README.md by @jeremyteh in https://github.com/danielgindi/Charts/pull/4886
    • Fix navigation bar transparent issue by @wlixcc in https://github.com/danielgindi/Charts/pull/4875
    • Update ChartDataSet.swift by @batikansosun in https://github.com/danielgindi/Charts/pull/4861
    • Fixes for Swift 5.7 compiler by @lukeredpath in https://github.com/danielgindi/Charts/pull/4823
    • Add double mark for compiler check related with issue #4835 by @eliakorkmaz in https://github.com/danielgindi/Charts/pull/4836
    • Fix chart only drawing first entry by @FelixHerrmann in https://github.com/danielgindi/Charts/pull/4829

    New Contributors

    • @jeremyteh made their first contribution in https://github.com/danielgindi/Charts/pull/4886
    • @wlixcc made their first contribution in https://github.com/danielgindi/Charts/pull/4875
    • @batikansosun made their first contribution in https://github.com/danielgindi/Charts/pull/4861
    • @lukeredpath made their first contribution in https://github.com/danielgindi/Charts/pull/4823
    • @eliakorkmaz made their first contribution in https://github.com/danielgindi/Charts/pull/4836
    • @FelixHerrmann made their first contribution in https://github.com/danielgindi/Charts/pull/4829

    Full Changelog: https://github.com/danielgindi/Charts/compare/v4.0.3...v4.1.0

    Source code(tar.gz)
    Source code(zip)
  • v4.0.3(May 25, 2022)

    What's Changed

    • Remove Cocoadocs reference from README by @rph8 in https://github.com/danielgindi/Charts/pull/4812
    • Highlighter fix by @kcome in https://github.com/danielgindi/Charts/pull/4721
    • Added tutorial links by @phuanggh in https://github.com/danielgindi/Charts/pull/4669
    • Update ChartData.swift by @truongtho1603 in https://github.com/danielgindi/Charts/pull/4822
    • Properties on axis renderers to Objc (Fixes #4800) by @SLambrakis in https://github.com/danielgindi/Charts/pull/4801

    New Contributors

    • @rph8 made their first contribution in https://github.com/danielgindi/Charts/pull/4812
    • @kcome made their first contribution in https://github.com/danielgindi/Charts/pull/4721
    • @phuanggh made their first contribution in https://github.com/danielgindi/Charts/pull/4669
    • @truongtho1603 made their first contribution in https://github.com/danielgindi/Charts/pull/4822
    • @SLambrakis made their first contribution in https://github.com/danielgindi/Charts/pull/4801

    Full Changelog: https://github.com/danielgindi/Charts/compare/v4.0.2...v4.0.3

    Source code(tar.gz)
    Source code(zip)
  • v4.0.2(Mar 12, 2022)

    • Fixes build issues by replacing class protocol conformance to AnyObject
    • Update swift-algorithms to 1.0
    • Add support for cocoapods for 4.0
    • Bump lowest supported versions to iOS 10, macOS 10.12, tvOS 10
    Source code(tar.gz)
    Source code(zip)
  • v4.0.1(Nov 6, 2020)

    v4.0.1 Release

    Thanks @jjatie, 4.0.1 release brings:

    Support Swift Package Manager and switch to another Snapshot test framework.

    Use Github Actions instead of Travis CI to run faster and work around Carthage issues against Xcode12.

    Snapshot UT now supports Apple Silicon.

    Adopt Swift-Algorithm crafted by Apple and the community.

    Full changelog


    We have merged our long waited 4.0 branch into master. It adopts latest Swift trends and benefits and more flexbile and More swift!

    This is a huge release as a lot of APIs have changed and adopted new protocols. So please expect it will break your code especially about the collection protocols. We will add a few Pull requests in the near future such as https://github.com/danielgindi/Charts/pull/4411.

    The pre-release could last a little bit longer since we don't want to push people to update. But we do encourage people to try it out and give us feed back.

    Source code(tar.gz)
    Source code(zip)
  • v3.6.0(Sep 21, 2020)

  • v3.5.0(Apr 16, 2020)

    Build on Xcode 11.4 and latest Swift (pod)

    Change log:https://github.com/danielgindi/Charts/blob/master/CHANGELOG.md

    Merged pull requests: Full github commit log

    Source code(tar.gz)
    Source code(zip)
  • v3.4.0(Oct 9, 2019)

    Support Xcode 11 and new Swift 5

    Bug Fix

    #4029: Index out of bounds exception in v3.2 in createAccessibleElement #4094: Horizontal Bezier Line Graph Not Drawing Through All Points #4093: Line chart x axis animation is broken #4099: Line renderer did not render lines if their coordinates fell outside of the viewport full change log:https://github.com/danielgindi/Charts/blob/master/CHANGELOG.md

    pod updated

    Source code(tar.gz)
    Source code(zip)
  • v3.3.0(Apr 24, 2019)

    This will be a breaking update due to #3847 that we changed dataSet initializers API interface and fixed Xcode warnings for previous release.

    pod has been updated again to 3.3.0 tag, it's previously using 3.3

    Now supports Xcode 10.2 and Swift 5.0

    Highlights of fixed issues and merged requests:

    • Renamed values to entries to reflect the property's type #3847 (jjatie)
    • Fix horizontal bar chart not drawing values and add unit tests #3906 (liuxuan30)
    • fix #3860. maxHeight didn't count the last label #3900 (liuxuan30)
    • Migrating to built-in algorithms #3892 (jjatie)
    • Use a stock iterator instead of a custom one. #3891 (phughes)
    • Removed unnecessary #if statements and unified style to align with Xc… #3884 (jjatie)
    • Velocity samples calculation #3883 (jjatie)
    • Minor updates for Swift 5 #3874 (jjatie)
    • Replace AnyObject with Any #3864 (jjatie)
    • Data as any #3863 (jjatie)
    • Reassess convenience initializers #3862 (jjatie)
    • HorizontalBarChar value label offset calculation #3854 (chaaarly)
    • Create chartViewDidEndAnimate in ChartViewDelegate #3852 (Lcsmarcal)
    • Align ChartLimit.LabelPosition naming with UIRectCorner #3846 (jjatie)

    Full change log

    https://github.com/danielgindi/Charts/blob/master/CHANGELOG.md

    Source code(tar.gz)
    Source code(zip)
  • v3.2.2(Feb 13, 2019)

    Highlights:

    Implemented enhancements:

    • Multiple colors for valueline (Fixes #3480) #3709 (AlexeiGitH)
      • use useValueColorForLine to enable the same colors
    • Add Collection conformances to ChartDataSet types #3815 (jjatie)
    • improvements in barRect height calculation #3650 (potato04)

    Fixed bugs:

    • CombinedChartView's candleData don't display in v3.2.0 #3662
    • Incorrect behavior for AxisBase.axisMaxLabels #3656
    • Horizontal Bar Chart legend issue #3301
    • Fixes sharp edges on the line chart #3764 (stokatyan)
    • Fix wrong assignment to axisMaxLabels property #3721 (ggirotto)
    • Fix legend offset bug for horizontal bar chart (Fixes #3301) #3736 (SvenMuc)
    • Add missing properties to copy(with:) methods #3715 (dstranz)
    • Fix applying lineCap value for line chart data sets (Fixes #3739) #3740 (anton-filimonov)
    • Fix memory leak after rendering #3680 (YusukeOba)
    • Fix condition that is checked before chartTranslated delegate method call #3804 (anton-filimonov)

    Other merged pull requests:

    Full changelog: https://github.com/danielgindi/Charts/blob/master/CHANGELOG.md

    Source code(tar.gz)
    Source code(zip)
  • v3.2.1(Oct 8, 2018)

  • v3.2.0(Sep 17, 2018)

  • v3.1.1(Apr 2, 2018)

  • v3.1.0(Mar 22, 2018)

    3.1 Release

    (including pod)

    1. Refactored some components to better align with latest Swift language trend by jjatie.
    2. For bug and PRs, please check changelog, or https://github.com/danielgindi/Charts/projects/6
    3. New unit tests for pie chart.
    4. Support Xcode 9.2 and Swift 4.0.3

    We are making Swift refactoring recently and target for 4.0 release along with some other features, thanks everyone for improving this project!

    Source code(tar.gz)
    Source code(zip)
  • v3.0.5(Jan 8, 2018)

    Refactoring and New

    1. Refactored some components to better align with latest Swift language trend by jjatie.
    2. Add a new DataApproximator+N #2848 by 666tos.
    3. New unit tests for CombinedChartView and demo builds checker.

    We are making Swift refactoring recently and target for 4.0 release along with some other features, thanks everyone for improving this project!

    Bug fixes

    to name a few that may impact users, others please refer change log:

    1. #2257 HorizontalBarChart does not update labels correctly
    2. #3132 Fix axis label disappear when zooming in deep enough
    3. #3149 Subclassing of LegendRenderer didn't take any effect
    4. #2049 fix the issue with axis dependencies in CombinedChartView
    5. Fix some Swift 4.0.3 errors to support Xcode 9.2
    Source code(tar.gz)
    Source code(zip)
  • v3.0.4(Sep 21, 2017)

  • v3.0.3(Sep 8, 2017)

  • v3.0.2(Apr 3, 2017)

  • v3.0.1(Nov 20, 2016)

    1. This release improves stability and fixes bugs.
    2. Added a new IndexAxisValueFormatter that you can pass an array of labels and have them behave like in Charts 2.0
    Source code(tar.gz)
    Source code(zip)
  • v2.3.1(Nov 4, 2016)

    Disclaimer: This is a legacy release to support Swift 2.3 for Charts v2.2.5. You are encouraged to move to Swift 3.0 and Charts 3.0

    Updates:

    • NSTouch extension for locationInView made the compiler error because it clashes with objc selector. Since it was not used in the library code it was removed.
    • Fix the image type of NSUIImagePNGRepresentation to be png instead of jpeg
    Source code(tar.gz)
    Source code(zip)
  • v3.0.0(Oct 19, 2016)

    This is a major release, with a few breaking changes. So please pay attention.

    Updates:

    • x-indexes are dead. Intoducing: x-values. Each entry now has an x and a y.
    • Pie/radar charts do not have a concept of X index anymore
    • Unified XAxis/YAxis features and experience.
    • Unified formatter interfaces for axes.
    • New formatter for y values, not inheriting from NSNumberFormatter anymore, to have dataSet and viewport information to take better formatting decisions.
    • Major refactoring of the Highlight mechanism.
    • Refactored marker mechanism
    • Refactored legend entry mechanism
    • Each dataset can now set its own legend form/size/etc.
    • More demos
    • Some classes have been renamed, keeping the namespaced name only in ObjC (using Swift 2.2 objc(...) feature, and the change of a major version update)
    • FillFormatter now has a block representation using FillFormatter.withblock(...)
    • Same goes for all Default formatters too.
    • No more saveToCameraRoll(). Since Xcode 8.0 it causes "privacy" issues with Apple Review, you have to add the photo albums privacy key to your Info.plist for that.
    • Moved to Swift 3.0. Make sure your project conforms to Swift 3.0.
    • Many minor bug fixes and improvements

    Breaking changes / how to migrate:

    • All dataset constructors have changed - they do not take an array of x-indices anymore.
    • All entry constructors have changed - they take in an X and a Y.
    • Pie and Radar chart entries now have their own classes. So exchange the Entry classes withPieChartDataEntry/RadarChartDataEntry
    • If you have any old startAtZeroEnabled calls - these have been deprecated for a long time. Replace them with axisMinimum.
    • If you are using formatters:
      • Replace any chart.valueFormatter = formatter with chart.valueFormatter = ChartDefaultValueFormatter(formatter: formatter) or chart.valueFormatter = [[ChartDefaultValueFormatter alloc] initWithFormatter:formatter];
      • Replace any axis.valueFormatter = formatter with axis.valueFormatter = ChartDefaultAxisValueFormatter(formatter: formatter) or axis.valueFormatter = [[ChartDefaultAxisValueFormatter alloc] initWithFormatter:formatter];
    • In general, all functions that accepted x-indices before, now accept an x-value, so you might have to adjust the names a little bit.
    • Where ChartViewDelegate is implemented, update the chartValueSelected interface
    • Replace drawSliceTextEnabled with drawEntryLabelsEnabled
    • If you have a custom scatter shape - implement an IShapeRenderer, and put your rendering code in there
    • If you have a custom marker - consider subclassing MarkerView/MarkerImage or implementing IMarker. There are more options than before now...
    • If you have used barSpace before, move to using barWidth
    • If you used saveToCameraRoll(), replace with UIImageWriteToSavedPhotosAlbum(chart.getChartImage(trasparent: false), nil, nil, nil)
    • Some classes have been renamed for a cleaner look. They do not contain the "Chart" prefix anymore. That's for Swift only, where there are namespaces. In ObjC the names stayed the same for the sake of namespacing, using Swift 2.2's feature of @objc(name). If your compiler yells that a class does not exist, try to remove the Chart from its name. This should rarely happen, as we've chosen only the classes that are rarely instantiated by the user.
    Source code(tar.gz)
    Source code(zip)
  • v2.3.0(Sep 21, 2016)

    Disclaimer: This is a legacy release to support Swift 2.3 for Charts v2.2.5. If you need Swift 3.0 support please wait for Charts v3.0.0 to be released

    Updates:

    • We've moved to Swift 2.3, which means that the minimum required Xcode version is now 8.0
    Source code(tar.gz)
    Source code(zip)
  • v2.2.5(May 30, 2016)

    • New: Horizontal cubic bezier lines for Line chart (through mode property)
    • New: Allow transparent color in circle hole color (Line chart)
    • New: circleHoleRadius property for more control over line chart circles
    • New: PieChart values outside of chart (connected with lines)
    • New: highlightFullBar for highlighting all values on an x-index at once
    • New: Allow setting xVals on existing Data objects
    • New: Allow bubble sizes to not be normalized against the dataset max
    • New: Added material color template
    • New: Flag to control whether we draw a limit line's labels
    • New: Exploded the Legend-Position enum to support more combinations
    • New: Allow drawing borders for bars in a Bar chart
    • Improved: Highlighting when multiple values on x-index present (bubble chart, combined chart)
    • Fixed: We are now taking into account the extra offsets for Pie/Radar chart view
    • Fixes regarding MarkerView
    • Fixes regarding the transition to Swift 2.2
    • Improvements to Demo, now keeping dataset styling when changin dataset size
    • General bugfixes

    Why newborn release? Because I have an amazing new baby girl!

    Source code(tar.gz)
    Source code(zip)
  • v2.2.4(Mar 31, 2016)

    • Breaking change: Simplified setting axis min and max value. Now instead of 4 different confusing variables for axis min/max, there's only one to mess with: axisMinValue and axisMaxValue. These are instead of customAxisMin/customAxisMax. And axisMinimum/axisMaximum do not exist anymore. (This change happened on the Android side too, and is mutually compatible)
    • We've moved to Swift 2.2, which means that the minimum required Xcode version is now 7.3
    • New support for stepped line charts!
    • The new zero-line feature now defaults to false
    • Fixes related to cubic-lines
    • Improvements to edge cases in Pie charts
    • Many more bugfixes
    Source code(tar.gz)
    Source code(zip)
  • v2.2.3(Feb 29, 2016)

    • OSX support! (Thanks goes to @pixelspark)
    • Viewport can now me moved with animations
    • New candlestick rendering mode - without the bars, just lines and ticks
    • New X shape for scatter chart
    • PieChart improvements (slice spacing and other stuff)
    • CandleStickChart improvements
    • BubbleChart improvements
    • RadarChart improvements
    • ScatterChart improvements
    • General improvements and bugfixes
    Source code(tar.gz)
    Source code(zip)
  • v2.2.2(Feb 9, 2016)

    • ChartsRealm is a separate framework now (to avoid dependency problems)
    • Add support for setting different colors for values
    • Other minor fixes
    Source code(tar.gz)
    Source code(zip)
  • v2.2.1(Feb 1, 2016)

  • v2.2.0(Jan 26, 2016)

    • Plotting data directly from Realm.io mobile data base
    • Realm.io tutorial
    • Introducing DataSet interfaces (e.g. ILineDataSet), allowing you to implement other sources for datasets, which could possibly be dynamic.
    • Made all renderer members public for extensibility, due to lack of protected in Swift
    • Many bugfixes and little improvements

    Note: This release may contain breaking changes for you if you have subclassed datasets/renderers.

    Source code(tar.gz)
    Source code(zip)
  • v2.1.6(Nov 2, 2015)

    • Feature: XAxis labels can now be rotated
    • Feature: Disable tap-highlighting separately from highlighting via drag or programmatically
    • Feature: Support for customizing description text position
    • Feature: Full tvOS support with Xcode 7.1
    • Bugfix: Default number of lines to skip in RadarChart was wrong
    • Bugfix: avoidFirstLastClipping has weird offsets sometimes
    • Bugfix: Fixed a case where of highlight not clearing on first tap
    • Bugfix: Fixes a potential crash in drawCircles()
    • Bugfix: Fixed deltaX in combined chart was not calculated in some cases
    • Bugfix: Fixed a bug where panning was disabled in BarLineChart if a drag offset was set
    • Improvements: More "dynamic" control over position of MarkerView
    • Other minor bugfixes
    Source code(tar.gz)
    Source code(zip)
  • v2.1.5(Oct 15, 2015)

    • LimitLine improvements (more customizeability)
    • Highlight improvements
    • Animation bug fixes
    • PieChart offset fixes
    • PieChart center text now supports NSAttributedString (centerAttributedText is recommended instead of centerText)
    • Support for custom alpha for pie hole
    • Minor bugfixes
    • Some code cleanup
    • Code safety improvements using Swift 2.0 (guard etc.)
    • Changed renderer delegates into DataProvider protocols, that more closely matches the Android version, and allows more flexibility.
    • Custom minimum offset for Bar/Line/Pie charts
    • Support for legends above the chart
    • A new tvOS target
    Source code(tar.gz)
    Source code(zip)
  • v2.1.4a(Oct 2, 2015)

    This is an intermediate release, with the following:

    1. CRITICAL fix for Radar Chart, for a bug that caused an endless loop due to skipWebLineCount feature.
    2. Custom minimum offset for Bar/Line/Pie charts
    3. Support for legends above the chart
    4. A new tvOS target
    5. Other minor features
    6. Other minor bugfixes and improvements
    Source code(tar.gz)
    Source code(zip)
Owner
Daniel Cohen Gindi
Daniel Cohen Gindi
Dr-Charts Easy to use, customizable and interactive charts library for iOS in Objective-C

dr-charts Easy to use, customizable and interactive charts library for iOS in Objective-C Features: Multiple chart types Line / Multiple lines / Lines

Zomato 93 Oct 10, 2022
An overview of the different types of charts you can make with Swift Charts

Swift Charts Examples This repo aims to provide sample code for lots of different chart types for you to use as inspiration for your own projects. We

Jordi Bruin 1.2k Dec 30, 2022
SwiftCharts - Easy to use and highly customizable charts library for iOS

SwiftCharts Easy to use and highly customizable charts library for iOS Features: Bars - plain, stacked, grouped, horizontal, vertical Scatter Lines (s

Ivan Schütz 2.4k Jan 4, 2023
🎉 SwiftUI stock charts for iOS

SwiftUI Stock Charts Display interactive stock charts easily ?? Instalation In Xcode go to File -> Swift packages -> Add package dependency Copy and p

Dennis Concepción Martín 94 Dec 26, 2022
🎉 SwiftUI stock charts for iOS

?? SwiftUI stock charts for iOS

Dennis Concepción Martín 94 Dec 26, 2022
An iOS wrapper for ChartJS. Easily build animated charts by leveraging the power of native Obj-C code.

TWRCharts TWRCharts An Obj-C wrapper for ChartJS. Easily build animated charts by leveraging the power of native code. TWRCharts is yet another charti

Michelangelo Chasseur 363 Nov 28, 2022
Light weight charts view generater for iOS. Written in Swift.

# ###Light weight charts view generater for iOS. Written in Swift. Requirements iOS 8.0+ XCode 7.3+ Installation CocoaPods $ pod init specify it in yo

Recruit Holdings. Media Technology Lab 982 Nov 16, 2022
Easy to use and highly customizable pie charts library for iOS

PieCharts Easy to use and highly customizable pie charts library for iOS Swift 4.2, iOS 8+ Video Features: Customizable slices Add overlays using simp

null 503 Dec 6, 2022
Core Charts | Basic Scrollable Chart Library for iOS

Core Charts | Basic Chart Library for iOS HCoreBarChart VCoreBarChart Requirements Installation Usage Appearance Customization Getting Started You nee

Çağrı ÇOLAK 71 Nov 17, 2022
FLCharts: Easy to use and highly customizable charts library for iOS

FLCharts Requirements Xcode 11 / Swift 5 iOS >= 11.0 Installation FLCharts is av

Francesco Leoni 250 Dec 26, 2022
Aplikasi iOS kasus Covid-19 di U.S dengan Storyboard, Framework Charts dari danielgindi, dan API dari covidtracking.com

Aplikasi iOS kasus Covid-19 di U.S dengan Storyboard, Framework Charts dari danielgindi, dan API dari covidtracking.com

DK 7 Aug 1, 2022
Easy to use and highly customizable pie charts library for iOS

PieCharts Easy to use and highly customizable pie charts library for iOS Swift 4.2, iOS 8+ Video Features: Customizable slices Add overlays using simp

null 503 Dec 6, 2022
SwiftUI Charts with custom styles

SwiftUI Charts Build custom charts with SwiftUI Styles Line Chart(data: [0.1, 0.3, 0.2, 0.5, 0.4, 0.9, 0.1]) .chartStyle( LineChartStyle(.

SpaceNation 609 Jan 6, 2023
A powerful 🚀 Android chart view / graph view library, supporting line- bar- pie- radar- bubble- and candlestick charts as well as scaling, panning and animations.

âš¡ A powerful & easy to use chart library for Android âš¡ Charts is the iOS version of this library Table of Contents Quick Start Gradle Maven Documentat

Philipp Jahoda 36k Jan 5, 2023
SwiftUICharts - A charts / plotting library for SwiftUI.

A charts / plotting library for SwiftUI. Works on macOS, iOS, watchOS, and tvOS and has accessibility features built in.

Will Dale 632 Jan 3, 2023
Health Sample app using Swift, RxSwift, Anchorage, Charts

HealthSample First run pod install, then build the project and run in your devices or simulators. This project has used RIBs, Swift, RxSwift, Anchorag

null 4 Feb 11, 2022
Using Swift Charts and Voiceover Chart Descriptor to compose music. 🤯

Chart de lune ?? Using Swift Charts and Voiceover Chart Descriptor to compose music. ?? Image source: https://hadikarimi.com/portfolio/claude-debussy-

An Trinh 31 Nov 21, 2022
A simple and beautiful chart lib used in Piner and CoinsMan for iOS(https://github.com/kevinzhow/PNChart) Swift Implementation

PNChart-Swift PNChart(https://github.com/kevinzhow/PNChart) Swift Implementation Installation This isn't on CocoaPods yet, so to install, add this to

Kevin 1.4k Nov 7, 2022