dr-charts
Easy to use, customizable and interactive charts library for iOS in Objective-C
Features:
- Multiple chart types
- Line / Multiple lines / Lines Parallel To X and Y -Axis
- Circular Charts
- Vertical Bar Charts
- Horizontal Stack Charts
- Pie Chart
- Easy to use: no learning curve, no complicated settings - just assemble Charts with the help of DataSource.
- Interactivity support - Easily accessible using the Delegates
- Extremely customizable
Objective-C, iOS 8+
Demo
Installation
CocoaPods is the recommended way to add Dr-Charts to your project.
Using CocoaPod
Simply add the following line to your Podfile and install the pod.
pod 'drCharts', :git => 'https://github.com/Zomato/DR-charts.git'
Where "dr-charts" is the name of the library.
The Old School Way
The simplest way to add Dr-Charts to your project is to drag and drop the /Classes folder into your Xcode project. It is also recommended to rename the /Classes folder to something more descriptive (i.e. 'Dr-Charts').
CHART TYPE
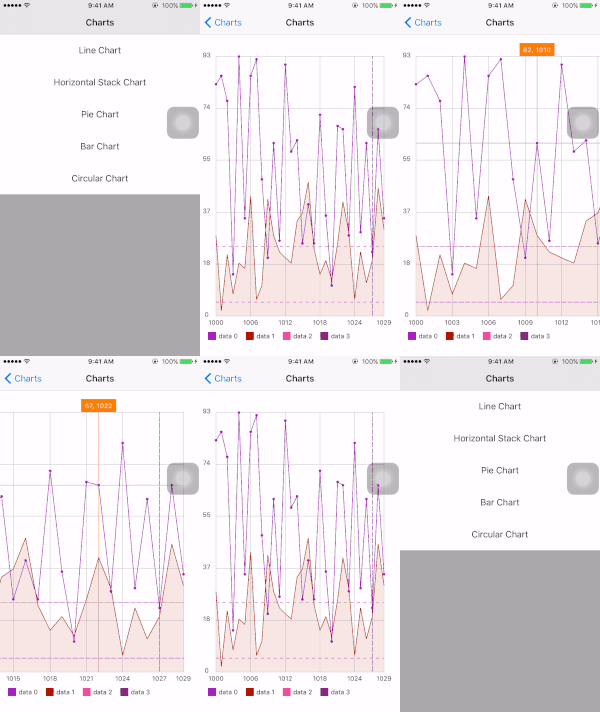
Line Chart
This is an example of Line Chart:
Set Properties
pragma Mark CreateLineGraph
- (void)createLineGraph{
    MultiLineGraphView *graph = [[MultiLineGraphView alloc] initWithFrame:CGRectMake(0, header_height, WIDTH(self.view), HEIGHT(self.view) - header_height)];

    [graph setDelegate:self];
    [graph setDataSource:self];

    [graph setShowLegend:TRUE];
    [graph setLegendViewType:LegendTypeHorizontal];

    [graph setDrawGridY:TRUE];
    [graph setDrawGridX:TRUE];

    [graph setGridLineColor:[UIColor lightGrayColor]];
    [graph setGridLineWidth:0.3];

    [graph setTextFontSize:12];
    [graph setTextColor:[UIColor blackColor]];
    [graph setTextFont:[UIFont systemFontOfSize:graph.textFontSize]];

    [graph setMarkerColor:[UIColor orangeColor]];
    [graph setMarkerTextColor:[UIColor whiteColor]];
    [graph setMarkerWidth:0.4];
    [graph setShowMarker:TRUE];
    [graph showCustomMarkerView:TRUE];

    [graph drawGraph];
    [self.view addSubview:graph];
}
Set DataSource
#pragma mark MultiLineGraphViewDataSource
- (NSMutableArray *)xDataForLineToBePlotted{
    NSMutableArray *array = [[NSMutableArray alloc] init];
    for (int i = 0; i < 30; i++) {
        [array addObject:[NSString stringWithFormat:@"%d", 1000 + i]];
    }
    return array;
}
- (NSInteger)numberOfLinesToBePlotted{
    return 2;
}
- (LineDrawingType)typeOfLineToBeDrawnWithLineNumber:(NSInteger)lineNumber{
    switch (lineNumber) {
        case 0:
            return LineDefault;
            break;
        case 1:
            return LineParallelXAxis;
            break;
    }
    return LineDefault;
}
- (UIColor *)colorForTheLineWithLineNumber:(NSInteger)lineNumber{
    NSInteger aRedValue = arc4random()%255;
    NSInteger aGreenValue = arc4random()%255;
    NSInteger aBlueValue = arc4random()%255;
    UIColor *randColor = [UIColor colorWithRed:aRedValue/255.0f green:aGreenValue/255.0f blue:aBlueValue/255.0f alpha:1.0f];
    return randColor;
}
- (CGFloat)widthForTheLineWithLineNumber:(NSInteger)lineNumber{
    return 1;
}
- (NSString *)nameForTheLineWithLineNumber:(NSInteger)lineNumber{
    return [NSString stringWithFormat:@"data %ld",(long)lineNumber];
}
- (BOOL)shouldFillGraphWithLineNumber:(NSInteger)lineNumber{
    switch (lineNumber) {
        case 0:
            return false;
            break;
        case 1:
            return true;
            break;
    }
    return false;
}
- (BOOL)shouldDrawPointsWithLineNumber:(NSInteger)lineNumber{
    switch (lineNumber) {
        case 0:
            return true;
            break;
        case 1:
            return false;
            break;
    }
    return false;
}
- (NSMutableArray *)dataForLineWithLineNumber:(NSInteger)lineNumber{
    switch (lineNumber) {
        case 0:
        {
            NSMutableArray *array = [[NSMutableArray alloc] init];
            for (int i = 0; i < 30; i++) {
                [array addObject:[NSNumber numberWithLong:random() % 100]];
            }
            return array;
        }
            break;
        case 1:
        {
            NSMutableArray *array = [[NSMutableArray alloc] init];
            [array addObject:[NSNumber numberWithLong:random() % 100]];
            [array addObject:[NSNumber numberWithLong:random() % 100]];

            return array;
        }
            break;
    }
    return [[NSMutableArray alloc] init];
}

- (UIView *)customViewForLineChartTouchWithXValue:(NSNumber *)xValue andYValue:(NSNumber *)yValue{
    UIView *view = [[UIView alloc] init];
    [view setBackgroundColor:[UIColor whiteColor]];
    [view.layer setCornerRadius:4.0F];
    [view.layer setBorderWidth:1.0F];
    [view.layer setBorderColor:[[UIColor lightGrayColor] CGColor]];
    [view.layer setShadowColor:[[UIColor blackColor] CGColor]];
    [view.layer setShadowRadius:2.0F];
    [view.layer setShadowOpacity:0.3F];

    UILabel *label = [[UILabel alloc] init];
    [label setFont:[UIFont systemFontOfSize:12]];
    [label setTextAlignment:NSTextAlignmentCenter];
    [label setText:[NSString stringWithFormat:@"Line Data: %@", yValue]];
    [label setFrame:CGRectMake(0, 0, 100, 30)];
    [view addSubview:label];

    [view setFrame:label.frame];
    return view;
}
Set Delegate
#pragma mark MultiLineGraphViewDelegate
- (void)didTapWithValuesAtX:(NSString *)xValue valuesAtY:(NSString *)yValue{
    NSLog(@"Line Chart: Value-X:%@, Value-Y:%@",xValue, yValue);
}
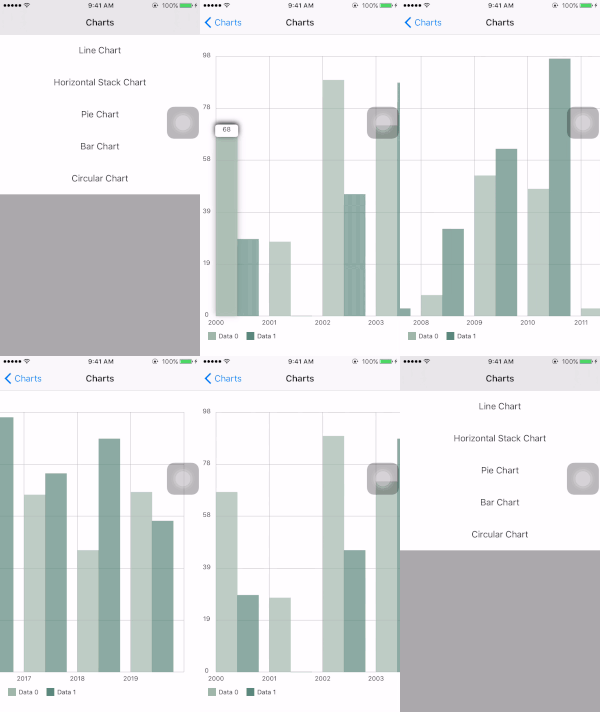
Bar Chart
This is an example of a Bar Chart:
Set Properties
#pragma Mark CreateHorizontalChart
- (void)createBarChart{
    BarChart *barChartView = [[BarChart alloc] initWithFrame:CGRectMake(0, header_height, WIDTH(self.view), HEIGHT(self.view) - header_height)];
    [barChartView setDataSource:self];
    [barChartView setDelegate:self];

    [barChartView setShowLegend:TRUE];
    [barChartView setLegendViewType:LegendTypeHorizontal];

    [barChartView setDrawGridY:TRUE];
    [barChartView setDrawGridX:TRUE];

    [barChartView setGridLineColor:[UIColor lightGrayColor]];
    [barChartView setGridLineWidth:0.3];

    [barChartView setTextFontSize:12];
    [barChartView setTextColor:[UIColor blackColor]];
    [barChartView setTextFont:[UIFont systemFontOfSize:barChartView.textFontSize]];

    [barChartView setShowCustomMarkerView:TRUE];
    [barChartView drawBarGraph];

    [self.view addSubview:barChartView];
}
Set DataSource
#pragma mark BarChartDataSource
- (NSMutableArray *)xDataForBarChart{
    NSMutableArray *array = [[NSMutableArray alloc] init];
    for (int i = 0; i < 20; i++) {
        [array addObject:[NSString stringWithFormat:@"%d", 2000 + i]];
    }
    return  array;
}

- (NSInteger)numberOfBarsToBePlotted{
    return 2;
}

- (UIColor *)colorForTheBarWithBarNumber:(NSInteger)barNumber{
    NSInteger aRedValue = arc4random()%255;
    NSInteger aGreenValue = arc4random()%255;
    NSInteger aBlueValue = arc4random()%255;
    UIColor *randColor = [UIColor colorWithRed:aRedValue/255.0f green:aGreenValue/255.0f blue:aBlueValue/255.0f alpha:1.0f];
    return randColor;
}

- (CGFloat)widthForTheBarWithBarNumber:(NSInteger)barNumber{
    return 40;
}

- (NSString *)nameForTheBarWithBarNumber:(NSInteger)barNumber{
    return [NSString stringWithFormat:@"Data %d",(int)barNumber];
}

- (NSMutableArray *)yDataForBarWithBarNumber:(NSInteger)barNumber{
    NSMutableArray *array = [[NSMutableArray alloc] init];
    for (int i = 0; i < 20; i++) {
        [array addObject:[NSNumber numberWithLong:random() % 100]];
    }
    return array;
}

- (UIView *)customViewForBarChartTouchWithValue:(NSNumber *)value{
    UIView *view = [[UIView alloc] init];
    [view setBackgroundColor:[UIColor whiteColor]];
    [view.layer setCornerRadius:4.0F];
    [view.layer setBorderWidth:1.0F];
    [view.layer setBorderColor:[[UIColor lightGrayColor] CGColor]];
    [view.layer setShadowColor:[[UIColor blackColor] CGColor]];
    [view.layer setShadowRadius:2.0F];
    [view.layer setShadowOpacity:0.3F];

    UILabel *label = [[UILabel alloc] init];
    [label setFont:[UIFont systemFontOfSize:12]];
    [label setTextAlignment:NSTextAlignmentCenter];
    [label setText:[NSString stringWithFormat:@"Bar Data: %@", value]];
    [label setFrame:CGRectMake(0, 0, 100, 30)];
    [view addSubview:label];

    [view setFrame:label.frame];
    return view;
}
Set Delegate
#pragma mark BarChartDelegate
- (void)didTapOnBarChartWithValue:(NSString *)value{
    NSLog(@"Bar Chart: %@",value);
}
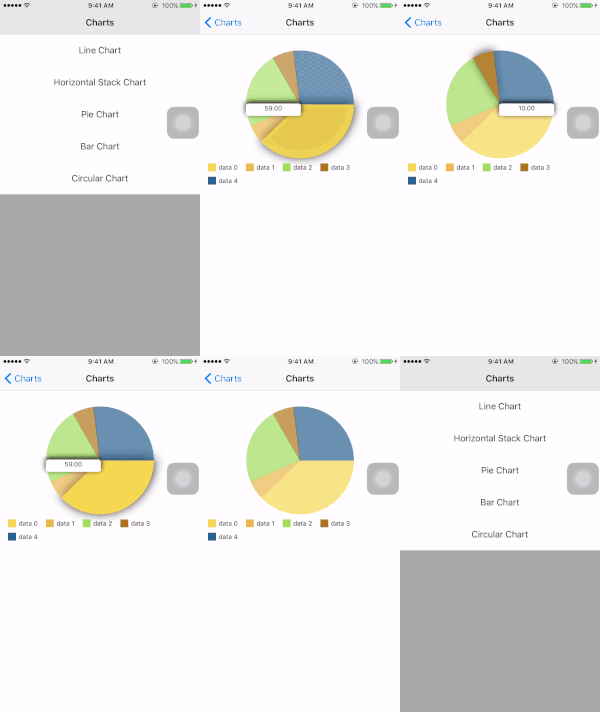
Pie Chart
This is an example of Pie Chart
Set Properties
#pragma Mark CreatePieChart
- (void)createPieChart{
    PieChart *chart = [[PieChart alloc] initWithFrame:CGRectMake(0, header_height, WIDTH(self.view), (HEIGHT(self.view) - header_height)/2)];
    [chart setDataSource:self];
    [chart setDelegate:self];

    [chart setShowLegend:TRUE];
    [chart setLegendViewType:LegendTypeHorizontal];

    [chart setTextFontSize:12];
    [chart setTextColor:[UIColor blackColor]];
    [chart setTextFont:[UIFont systemFontOfSize:chart.textFontSize]];

    [chart setShowValueOnPieSlice:TRUE];
    [chart setShowCustomMarkerView:TRUE];

    [chart drawPieChart];
    [self.view addSubview:chart];
}
Set DataSource
#pragma mark PieChartDataSource
- (NSInteger)numberOfValuesForPieChart{
    return 5;
}

- (UIColor *)colorForValueInPieChartWithIndex:(NSInteger)lineNumber{
    NSInteger aRedValue = arc4random()%255;
    NSInteger aGreenValue = arc4random()%255;
    NSInteger aBlueValue = arc4random()%255;
    UIColor *randColor = [UIColor colorWithRed:aRedValue/255.0f green:aGreenValue/255.0f blue:aBlueValue/255.0f alpha:1.0f];
    return randColor;
}

- (NSString *)titleForValueInPieChartWithIndex:(NSInteger)index{
    return [NSString stringWithFormat:@"data %ld",(long)index];
}

- (NSNumber *)valueInPieChartWithIndex:(NSInteger)index{
    return [NSNumber numberWithLong:random() % 100];
}

- (UIView *)customViewForPieChartTouchWithValue:(NSNumber *)value{
    UIView *view = [[UIView alloc] init];
    [view setBackgroundColor:[UIColor whiteColor]];
    [view.layer setCornerRadius:4.0F];
    [view.layer setBorderWidth:1.0F];
    [view.layer setBorderColor:[[UIColor lightGrayColor] CGColor]];
    [view.layer setShadowColor:[[UIColor blackColor] CGColor]];
    [view.layer setShadowRadius:2.0F];
    [view.layer setShadowOpacity:0.3F];

    UILabel *label = [[UILabel alloc] init];
    [label setFont:[UIFont systemFontOfSize:12]];
    [label setTextAlignment:NSTextAlignmentCenter];
    [label setText:[NSString stringWithFormat:@"Pie Data: %@", value]];
    [label setFrame:CGRectMake(0, 0, 100, 30)];
    [view addSubview:label];

    [view setFrame:label.frame];
    return view;
}
Set Delegate
#pragma mark PieChartDelegate
- (void)didTapOnPieChartWithValue:(NSString *)value{
    NSLog(@"Pie Chart: %@",value);
}
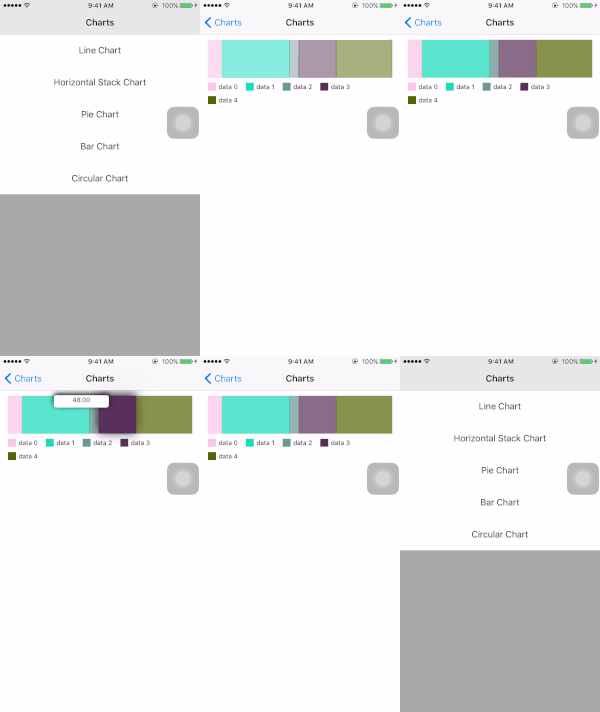
Horizontal Stack Chart
This is an example of Horizontal Stack Chart
Set Properties
#pragma Mark CreateHorizontalChart
- (void)createHorizontalStackChart{
    HorizontalStackBarChart *chartView = [[HorizontalStackBarChart alloc] initWithFrame:CGRectMake(0, header_height, WIDTH(self.view), 150)];
    [chartView setDataSource:self];
    [chartView setDelegate:self];

    [chartView setShowLegend:TRUE];
    [chartView setLegendViewType:LegendTypeHorizontal];

    [chartView setTextFontSize:12];
    [chartView setTextColor:[UIColor blackColor]];
    [chartView setTextFont:[UIFont systemFontOfSize:chartView.textFontSize]];

    [chartView setShowValueOnBarSlice:TRUE];
    [chartView setShowCustomMarkerView:TRUE];

    [chartView drawStackChart];
    [self.view addSubview:chartView];
}
Set DataSource
#pragma mark HorizontalStackBarChartDataSource
- (NSInteger)numberOfValuesForStackChart{
    return 5;
}

- (UIColor *)colorForValueInStackChartWithIndex:(NSInteger)index{
    NSInteger aRedValue = arc4random()%255;
    NSInteger aGreenValue = arc4random()%255;
    NSInteger aBlueValue = arc4random()%255;
    UIColor *randColor = [UIColor colorWithRed:aRedValue/255.0f green:aGreenValue/255.0f blue:aBlueValue/255.0f alpha:1.0f];
    return randColor;
}

- (NSString *)titleForValueInStackChartWithIndex:(NSInteger)index{
    return [NSString stringWithFormat:@"data %ld",(long)index];
}

- (NSNumber *)valueInStackChartWithIndex:(NSInteger)index{
    return [NSNumber numberWithLong:random() % 100];
}

- (UIView *)customViewForStackChartTouchWithValue:(NSNumber *)value{
    UIView *view = [[UIView alloc] init];
    [view setBackgroundColor:[UIColor whiteColor]];
    [view.layer setCornerRadius:4.0F];
    [view.layer setBorderWidth:1.0F];
    [view.layer setBorderColor:[[UIColor lightGrayColor] CGColor]];
    [view.layer setShadowColor:[[UIColor blackColor] CGColor]];
    [view.layer setShadowRadius:2.0F];
    [view.layer setShadowOpacity:0.3F];

    UILabel *label = [[UILabel alloc] init];
    [label setFont:[UIFont systemFontOfSize:12]];
    [label setTextAlignment:NSTextAlignmentCenter];
    [label setText:[NSString stringWithFormat:@"Stack Data: %@", value]];
    [label setFrame:CGRectMake(0, 0, 100, 30)];
    [view addSubview:label];

    [view setFrame:label.frame];
    return view;
}
Set Delegate
#pragma mark HorizontalStackBarChartDelegate
- (void)didTapOnHorizontalStackBarChartWithValue:(NSString *)value{
    NSLog(@"Horizontal Stack Chart: %@",value);
}
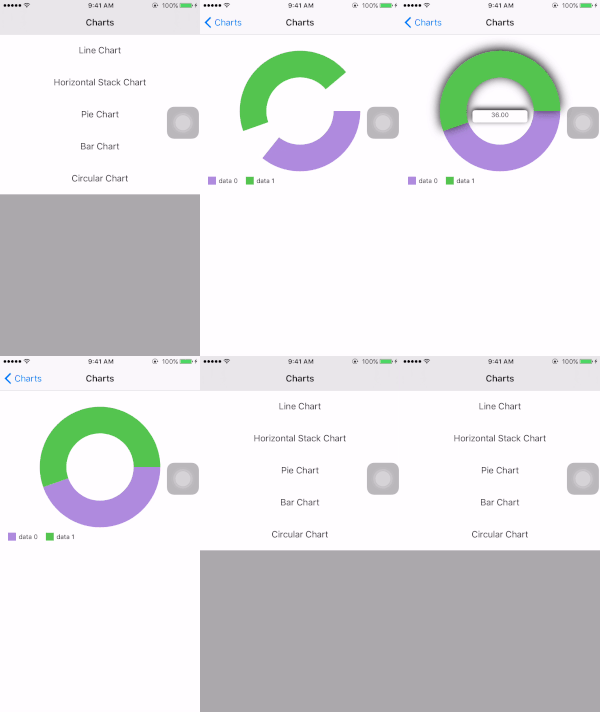
Circular Chart
This is an example of Circular Chart
Set Properties
#pragma Mark CreateCircularChart
- (void)createCircularChart{
    CircularChart *chart = [[CircularChart alloc] initWithFrame:CGRectMake(0, header_height, WIDTH(self.view), (HEIGHT(self.view) - header_height)/2)];
    [chart setDataSource:self];
    [chart setDelegate:self];

    [chart setShowLegend:TRUE];
    [chart setLegendViewType:LegendTypeHorizontal];

    [chart setTextFontSize:12];
    [chart setTextColor:[UIColor blackColor]];
    [chart setTextFont:[UIFont systemFontOfSize:chart.textFontSize]];

    [chart setShowCustomMarkerView:TRUE];

    [chart drawPieChart];
    [self.view addSubview:chart];
}
Set DataSource
#pragma mark CircularChartDataSource
- (CGFloat)strokeWidthForCircularChart{
    return 50;
}

- (NSInteger)numberOfValuesForCircularChart{
    return 2;
}

- (UIColor *)colorForValueInCircularChartWithIndex:(NSInteger)lineNumber{
    NSInteger aRedValue = arc4random()%255;
    NSInteger aGreenValue = arc4random()%255;
    NSInteger aBlueValue = arc4random()%255;
    UIColor *randColor = [UIColor colorWithRed:aRedValue/255.0f green:aGreenValue/255.0f blue:aBlueValue/255.0f alpha:1.0f];
    return randColor;
}

- (NSString *)titleForValueInCircularChartWithIndex:(NSInteger)index{
    return [NSString stringWithFormat:@"data %ld",(long)index];
}

- (NSNumber *)valueInCircularChartWithIndex:(NSInteger)index{
    return [NSNumber numberWithLong:random() % 100];
}

- (UIView *)customViewForCircularChartTouchWithValue:(NSNumber *)value{
    UIView *view = [[UIView alloc] init];
    [view setBackgroundColor:[UIColor whiteColor]];
    [view.layer setCornerRadius:4.0F];
    [view.layer setBorderWidth:1.0F];
    [view.layer setBorderColor:[[UIColor lightGrayColor] CGColor]];
    [view.layer setShadowColor:[[UIColor blackColor] CGColor]];
    [view.layer setShadowRadius:2.0F];
    [view.layer setShadowOpacity:0.3F];

    UILabel *label = [[UILabel alloc] init];
    [label setFont:[UIFont systemFontOfSize:12]];
    [label setTextAlignment:NSTextAlignmentCenter];
    [label setText:[NSString stringWithFormat:@"Circular Data: %@", value]];
    [label setFrame:CGRectMake(0, 0, 100, 30)];
    [label setAdjustsFontSizeToFitWidth:TRUE];
    [view addSubview:label];

    [view setFrame:label.frame];
    return view;
}
Set Delegate
#pragma mark CircularChartDelegate
- (void)didTapOnCircularChartWithValue:(NSString *)value{
    NSLog(@"Circular Chart: %@",value);
}
 I tried to reset the view in some ways, but without any luck.