SwiftChart - A simple line and area charting library for iOS.

Overview

SwiftChart

Version License Platform

A simple line and area charting library for iOS.

  • 📈 Line and area charts
  • 🌞 Multiple series
  • 🌒 Partially filled series
  • 🏊 Works with signed Double
  • 🖖 Touch events


Table of Content

Getting started

Installing SwiftChart via CocoaPods

SwiftChart is available through CocoaPods. To install it, simply add the following line to your Podfile:

pod "SwiftChart"

Installing SwiftChart manually

  1. Download SwiftChart.zip from the last release and extract its content in your project's folder.
  2. From the Xcode project, choose Add Files to ... from the File menu and add the extracted files.

What’s included in SwiftChart

The library includes:

  • the Chart main class, to initialize and configure the chart’s content, e.g. for adding series or setting up the its appearance
  • the ChartSeries class, for creating datasets and configure their appearance
  • the ChartDelegate protocol, which tells other objects about the chart’s touch events
  • the ChartColor struct, containing some predefined colors

Example

let chart = Chart()
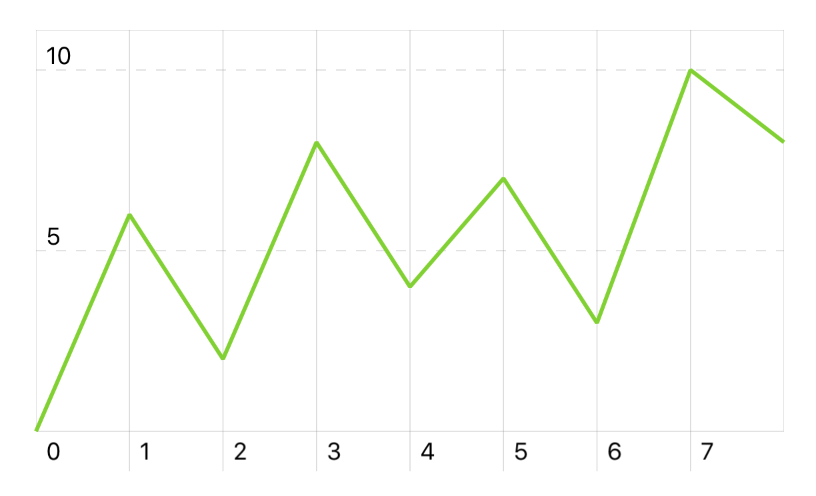
let series = ChartSeries([0, 6, 2, 8, 4, 7, 3, 10, 8])
series.color = ChartColors.greenColor()
chart.add(series)

To run the example project, clone the repo, and run pod install from the Example directory first.

How to use SwiftChart

Initialize a chart from the Interface Builder

The chart can be initialized from the Interface Builder. Drag a normal View into a View Controller and assign to it the Chart Custom Class from the Identity Inspector.

Initialize a chart programmatically

To initialize a chart programmatically, use the Chart(frame: ...) initializer, which requires a frame:

let chart = Chart(frame: CGRect(x: 0, y: 0, width: 200, height: 100))

If you prefer to use Autolayout, set the frame to 0 and add the constraints later:

let chart = Chart(frame: CGRectZero)
// add constraints now

Adding a series to a chart

Initialize each series before adding them to the chart. To do so, pass an array to initialize a ChartSeries object:

let chart = Chart(frame: CGRect(x: 0, y: 0, width: 200, height: 100))
let series = ChartSeries([0, 6.5, 2, 8, 4.1, 7, -3.1, 10, 8])
chart.add(series)

Result:

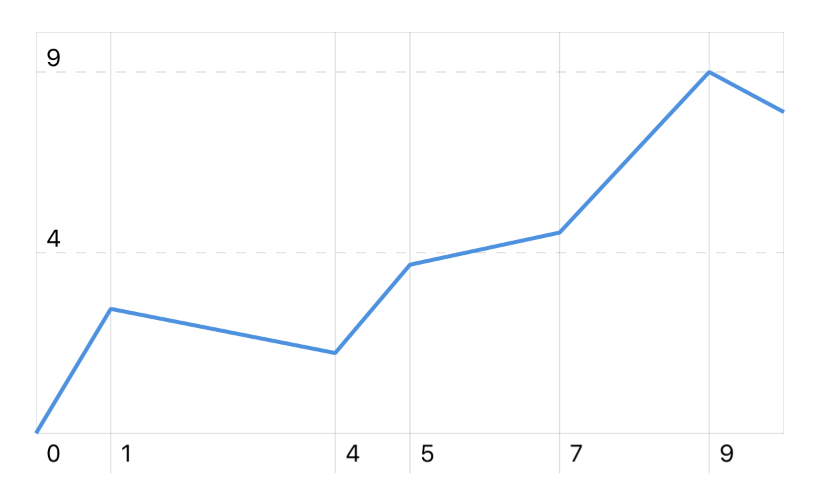
As you can see, as default the values on the x-axis are the progressive indexes of the passed array. You can customize those values by passing an array of (x: Double, y: Double) tuples to the series initializer:

let chart = Chart(frame: CGRect(x: 0, y: 0, width: 200, height: 100))
// Create a new series specifying x and y values
let data = [
  (x: 0, y: 0),
  (x: 1, y: 3.1),
  (x: 4, y: 2),
  (x: 5, y: 4.2),
  (x: 7, y: 5),
  (x: 9, y: 9),
  (x: 10, y: 8)
]
let series = ChartSeries(data: data)
chart.add(series)

Result:

Using partially filled series

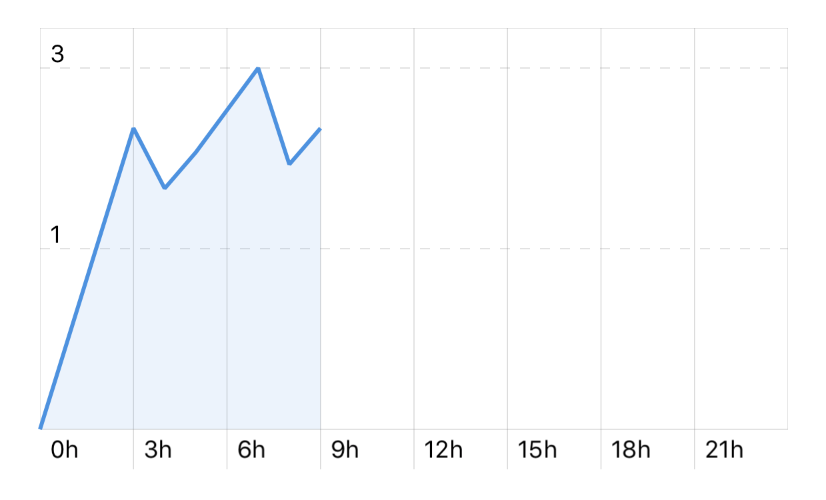
Use the chart.xLabels property to make the x-axis showing more labels than those inferred from the actual data. For example,

let chart = Chart(frame: CGRect(x: 0, y: 0, width: 200, height: 100))
let data = [
  (x: 0, y: 0),
  (x: 3, y: 2.5),
  (x: 4, y: 2),
  (x: 5, y: 2.3),
  (x: 7, y: 3),
  (x: 8, y: 2.2),
  (x: 9, y: 2.5)
]
let series = ChartSeries(data: data)
series.area = true

// Use `xLabels` to add more labels, even if empty
chart.xLabels = [0, 3, 6, 9, 12, 15, 18, 21, 24]

// Format the labels with a unit
chart.xLabelsFormatter = { String(Int(round($1))) + "h" }

chart.add(series)

Result:

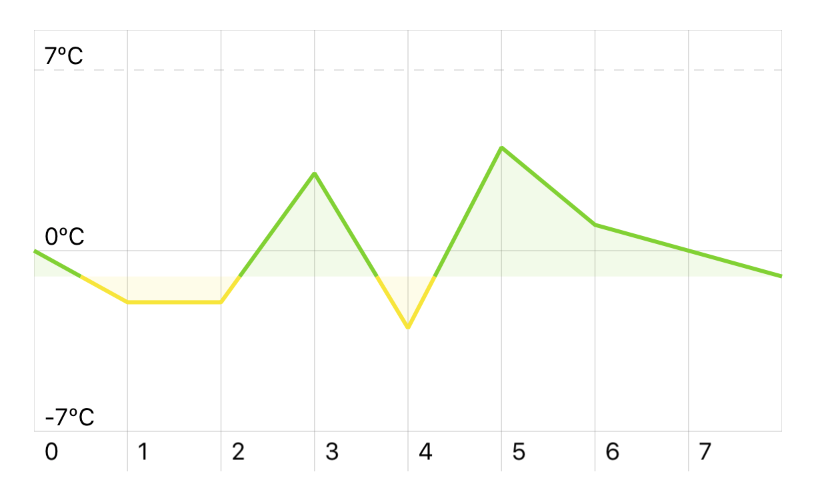
Using different colors above and below zero

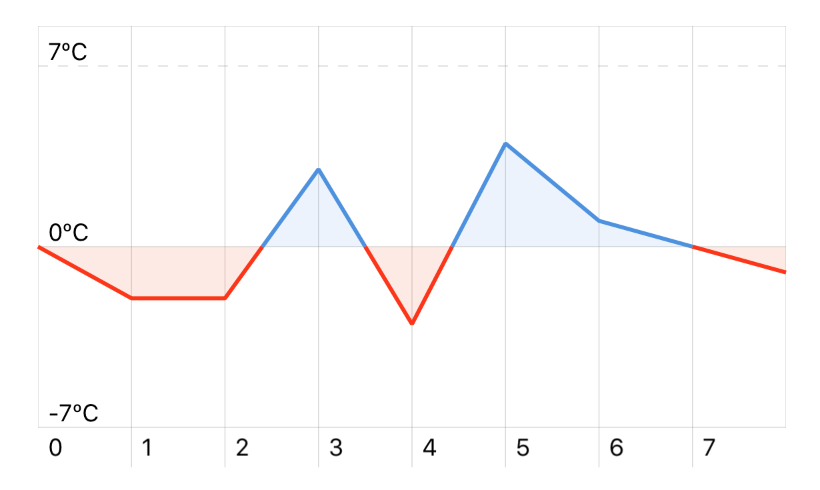
The chart displays the series in different colors when below or above the zero-axis:

let chart = Chart(frame: CGRect(x: 0, y: 0, width: 200, height: 100))
let data: [Double] = [0, -2, -2, 3, -3, 4, 1, 0, -1]

let series = ChartSeries(data)
series.area = true

chart.add(series)

// Set minimum and maximum values for y-axis
chart.minY = -7
chart.maxY = 7

// Format y-axis, e.g. with units
chart.yLabelsFormatter = { String(Int($1)) +  "ºC" }

Result:

You can customize the zero-axis and the colors with the colors options in the ChartSeries class.

series.colors = (
  above: ChartColors.greenColor(),
  below: ChartColors.yellowColor(),
  zeroLevel: -1
)

Result:

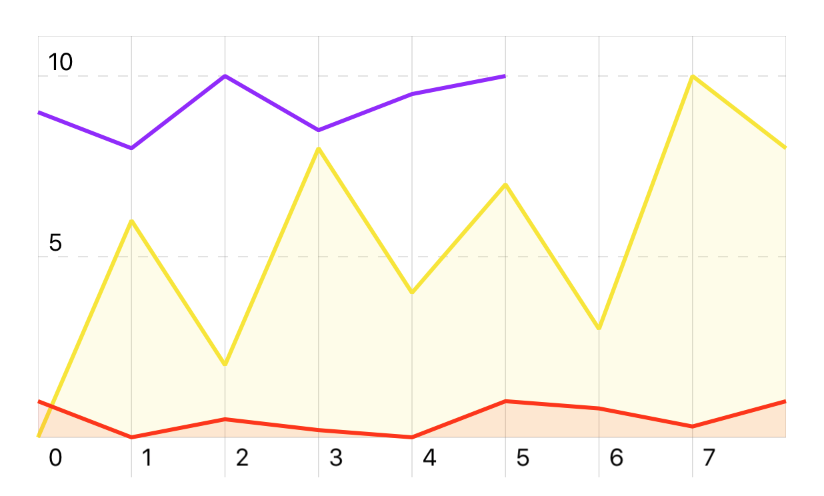
Adding multiple series to a chart

Using the chart.add(series: ChartSeries) and chart.add(series: Array) methods you can add more series. Those will be indentified with a progressive index in the chart’s series property.

let chart = Chart(frame: CGRect(x: 0, y: 0, width: 200, height: 100))

let series1 = ChartSeries([0, 6, 2, 8, 4, 7, 3, 10, 8])
series1.color = ChartColors.yellowColor()
series1.area = true

let series2 = ChartSeries([1, 0, 0.5, 0.2, 0, 1, 0.8, 0.3, 1])
series2.color = ChartColors.redColor()
series2.area = true

// A partially filled series
let series3 = ChartSeries([9, 8, 10, 8.5, 9.5, 10])
series3.color = ChartColors.purpleColor()

chart.add([series1, series2, series3])

Result:

screen shot 2018-01-07 at 11 06 55

Configuring touch events

To make the chart respond to touch events, implement the ChartDelegate protocol in your class, e.g. a View Controller, and then set the chart’s delegate property:

class MyViewController: UIViewController, ChartDelegate {
  override func viewDidLoad() {
    let chart = Chart(frame: CGRect(x: 0, y: 0, width: 100, height: 200))
    chart.delegate = self
  }

  // Chart delegate
  func didTouchChart(chart: Chart, indexes: Array<Int?>, x: Double, left: CGFloat) {
    // Do something on touch
  }

  func didFinishTouchingChart(chart: Chart) {
    // Do something when finished
  }

  func didEndTouchingChart(chart: Chart) {
    // Do something when ending touching chart
  }
}

The didTouchChart method passes an array of indexes, one for each series, with an optional Int referring to the data’s index:

 func didTouchChart(chart: Chart, indexes: Array<Int?>, x: Double, left: CGFloat) {
    for (seriesIndex, dataIndex) in enumerate(indexes) {
      if dataIndex != nil {
        // The series at `seriesIndex` is that which has been touched
        let value = chart.valueForSeries(seriesIndex, atIndex: dataIndex)
      }
    }
  }

You can use chart.valueForSeries() to access the value for the touched position.

The x: Double argument refers to the value on the x-axis: it is inferred from the horizontal position of the touch event, and may be not part of the series values.

The left: CGFloat is the x position on the chart’s view, starting from the left side. It may be used to set the position for a label moving above the chart:

API

Chart class

Use the Chart class to initialize and configure the chart’s content, e.g. for adding series or setting up the its appearance.

Example

let chart = Chart(frame: CGRect(x: 0, y: 0, width: 200, height: 100))

Chart options

Option Name Description
areaAlphaComponent Alpha factor for the areas colors (CGFloat, default 0.1)
axesColor The color of the axes (UIColor, default .gray)
bottomInset Height of the area at the bottom of the chart, containing the labels for the x-axis (CGFloat, default 20)
delegate The delegate to listen to touch events (ChartDelegate)
highlightLineColor The color of the highlight line (UIColor, default gray)
highlightLineWidth The width of the highlight line (CGFloat, default 0.5)
hideHighlightLineOnTouchEnd Hide the highlight line when the touch event ends, e.g. when stop swiping over the chart (Bool, default false)
gridColor The color of the grid (UIColor, default .gray)
labelColor The color of the labels (UIColor, default .black)
labelFont The font used for the labels (UIFont?)
lineWidth The width of the chart's lines (CGFloat, default 2)
maxX A custom maximum x-value (Double?)
maxY A custom maximum y-value (Double?)
minX A custom minimum x-value (Double?)
minY A custom minimum y-value (Double?)
showXLabelsAndGrid Enable the lines for the labels on the x-axis (Bool, default true)
showYLabelsAndGrid Enable the lines for the labels on the y-axis (Bool, default true)
topInset Height of the area at the top of the chart, acting a padding to make place for the top y-axis label (CGFloat, default 20)
xLabels The values to display as labels on the x-axis. You can format these values with the xLabelFormatter attribute. As default, it will display the values of the series which has the most data. [Double]?
xLabelsFormatter Function to format the labels on the x-axis ((Int, Double) -> String)
xLabelsOrientation: Set the x-axis labels orientation to vertical or horizontal (ChartLabelOrientation, default .horizontal)
xLabelsTextAlignment: Alignment for the text in the x-labels (NSTextAlignment, default .left)
xLabelsSkipLast: Skip the last x-label. Setting this to false will make the label overflow the frame width, so use carefully (Bool, default true)
yLabels Values to display as labels of the y-axis. If not specified, will display the lowest, the middle and the highest values.
yLabelsFormatter Function to format the labels on the y-axis ((Int, Double) -> String)
yLabelsOnRightSide Place the y-labels on the right side (Bool, default false)

Public Methods

Method Name Description
add Add a series to the chart (_ series: ChartSeries) (_ series: [ChartSeries])
removeSeriesAt Remove the series at the specified index (_ index: Int)
removeAllSeries Remove all the series
valueForSeries Returns the value for the specified series at the given index (_ seriesIndex: Int, atIndex dataIndex: Int?) -> Double?

ChartSeries class

Use the ChartSeries class to create a chart series and configure its appearance and behavior.

Example

let data: [Double] = [0, -2, -2, 3, -3, 4, 1, 0, -1]
let series = ChartSeries(data)
Option Name Description
area Draws an area below the series line (Bool, default false)
line When set to false, will hide the series line. Useful for drawing only the area with area=true (Bool, default true)
color The series color. You can use the ChartColors struct for some colors shortcuts. (UIColor, default .blueColor())
colors A tuple to specify the color above or below the zero (or the value specified by zeroLevel) (above: UIColor, below: UIColor, zeroLevel: Double)

ChartDelegate protocol

Use the ChartDelegate protocol to tell other objects about the chart’s touch events.

Method Description
didTouchChart Tells the delegate that the specified chart has been touched
didFinishTouchingChart Tells the delegate that the user finished touching the chart. The user will "finish" touching the chart only swiping left/right outside the chart.
didEndTouchingChart Tells the delegate that the user ended touching the chart. The user will "end" touching the chart whenever the touchesDidEnd method is being called.

ChartColors enum

Shorthands for various colors.

Example

let series = ChartSeries([0, 6, 2, 8, 4, 7, 3, 10, 8])
series.color = ChartColors.blueColor()

Common issues and solutions

If you have issue with this library, please tag your question with swiftchart on Stack Overflow.

The chart is not showing

The Chart class inherits from UIView, so if your chart is not displaying it is likely a problem related to the view's size. Check your view constraints and make sure you initialize it on viewDidLoad, when UIKit can calculate the view dimensions.

Some tips for debugging an hidden chart:

  • start your app and then debug the UI Hierarchy from the Debug navigator
  • initialize a simple UIView with a colored background instead of the chart to easily see how the view is positioned
  • try to not to nest the chart in a subview for better debugging

License

SwiftChart is available under the MIT license. See the LICENSE file for more info.

Comments
  • series not showing up in the view

    series not showing up in the view

    First of all, thanks for your cool repo! I have this app that gets some data from server using Alamofire, and I want to show the data on a chart using your library, I have the following code:

    
        @IBOutlet weak var chart: Chart!
    
        // MARK: - view controller life cycle
    
        override func viewDidLoad() {
            super.viewDidLoad()
    
            /*let series = ChartSeries([0, 6, 2, 8, 4, 7, 3, 10, 8])
            series.color = ChartColors.greenColor()
            chart.addSeries(series)*/
            self.getPriceList()
        }
    
        // MARK: - ui code
    
        func updateChart() {
    
            /*var data : [Float] = []
            for (_, node) in self.priceList {
                print(node)
                data.append(node["y"].floatValue)
            }*/
            dispatch_async(dispatch_get_main_queue(), { () -> Void in
                /*let serie = ChartSeries(data)
                serie.color = ChartColors.blueColor()
                self.chart.addSeries(serie)*/
                let series = ChartSeries([3, 5, 2, 2, 4, 7, 3, 10, 8])
                series.color = ChartColors.blueColor()
                self.chart.addSeries(series)
            })
        }
    
        // MARK: - api calls, parsing and processing responses
    
        func getPriceList() {
            let requestDictionary = [
                "action": "GetInstruemntChart",
                "sessionID": Configurations.sessionID,
                "versionCode": "\(Configurations.versionCode)",
                "duration": "3"
            ]
    
            Alamofire.upload(
                .POST,
                Configurations.baseURL,
                multipartFormData: { multipartFormData in
                    Networking.multipartFormDataBody(multipartFormData, dictionary: requestDictionary)
                },
                encodingCompletion: { encodingResult in
                    switch encodingResult {
                    case .Success(let upload, _, _):
                        upload.responseData() {response in
                            if let data = response.result.value {
                                debugPrint("got price list")
                                self.parsePriceListResponse(data)
                            }
                        }
                    case .Failure(let encodingError):
                        print(encodingError)
                    }
                }
            )
        }
    
        func parsePriceListResponse(data: NSData) {
            let json = JSON(data: data)
    
            self.priceList = json["priceList"]
            self.updateChart()
        }
    

    I added the view in IB, but after getting the response, the chart series is not shown on the view(only the vertical line indicator for the chart appears and moves with touch events). As you can see I commented the code which tries to use the server data to draw the chart and added a simple code from your example and still nothing shows up.

    ps: in my code, in viewDidLoad method, I added a simple series to check if the chart works at all and that one is shown, but the one in updateChart is not.

    this is the chart view as i described.

    screen shot 2016-02-14 at 1 16 49 am

    is there something I'm doing wrong?

    opened by r-shayestehpour 18
  • Display the last label to the x axis

    Display the last label to the x axis

    The last char (here "D") is not displayed.

    var labelsAsString: Array = ["L", "M", "M", "J", "V", "S", "D"] stats.xLabelsFormatter = { (labelIndex: Int, labelValue: Float) -> String in return labelsAsString[labelIndex] }

    Even if we use xLabelsTextAlignment = .left

    capture d ecran 2016-10-16 a 14 24 28

    capture d ecran 2

    enhancement 
    opened by Cyphontin 11
  • Feature request: custom threshold for positive/negative data display

    Feature request: custom threshold for positive/negative data display

    I'm wondering if it's possible to set a custom threshold for positive/negative display of data? For example, I'd like to set a value of 5 where a value between 0-5 is red and 5-10 is blue.

    It appears this functionality is only available if the value is below zero.

    Thanks for your consideration.

    opened by 9SL9 8
  • Xcode 10 and Swift 4.2 fix

    Xcode 10 and Swift 4.2 fix

    renamed kCALineJoinBevel to CAShapeLayerLineJoin.bevel so that SwiftChart is able to compile inside Xcode 10 and project set to Swift 4.2

    This is my first PR on an open source project so if there is something false, please let me know 🙌

    opened by yasinkavakli 6
  • Swift 3 Compatibility

    Swift 3 Compatibility

    Hey, so, I've never actually contributed to a project before, but I downloaded this earlier hoping to use it in my app (Swift 3/iOS 10). Obviously with all the syntax changes between Swift 2 & 3 it didn't work automatically, so I went ahead and updated Chart.swift with the changes to CGPathAddLineToPoint, CGPathMoveToPoint and the like to bring it up to compatibility with Swift 3.

    As I said, I've never contributed to a project before. Just started using git about a month ago, in fact. Not even sure what the proper way to go about submitting the changes back for approval is, but I'd be more than happy to provide the updated file!

    opened by Bonney 6
  • Bug: red lines and area with positive values

    Bug: red lines and area with positive values

    Hello,

    Thanks for creating this library!

    I'm not sure if this one is a bug or not, but I tried to create a chart from the example chart with y-min and y-max and I'm not sure if the chart generates correctly.

    image

    There are some red lines and area with certainly positive values in its data. Is this a normal behavior?

    I tried to check the value of the series and it does indeed positive (more than 0)

    Any help would be appreciated!

    bug 
    opened by aalfath 6
  • Ignore values

    Ignore values

    I have an array with default values of -1 in each element - the code I have will change some of this based on events in the app. How do I only display the updated values and have SwiftChart ignore values below 0?

    question 
    opened by 9SL9 4
  • Chart drawn with an offset in IB

    Chart drawn with an offset in IB

    When I add a Chart to the storyboard, it looks like this:

    screen shot 2016-12-29 at 4 45 07 pm

    This makes it look like that the grey area that says "Chart" is the frame of the chart. However, it isn't. When I double click on the chart, everything except the frame darkens so the frame of the chart is the brightest. The result looks like this:

    screen shot 2016-12-29 at 4 44 52 pm

    As you can see, the grey part isn't really the frame. It's quite confusing. Can you fix that?

    opened by Sweeper777 4
  • Why only can set the chart in

    Why only can set the chart in "ViewDidLoad"

    Hi , I got strange issue , why only can init the chart in "ViewDidLoad" ???

    I was try to add an IBAction for remove series or update the chart .

    But nothing happen ???

    Does anyone has same problem like me ???

    opened by WebberLai 4
  • Add more chart types?

    Add more chart types?

    I have used a lot of chart pods but none of them is as easy to use as this one. It would be really good if more chart types are supported. Maybe add a bar chart?

    opened by Sweeper777 4
  • Custom threshold for positive/negative data display

    Custom threshold for positive/negative data display

    Introduces feature requested in #43 The threshold can be set by changing chartSeries.colors.zeroLevel value.

    Looks like this: screen shot 2016-11-14 at 10 54 20 pm with one of sample chart series and

    series.colors.zeroLevel = -1.5
    
    opened by algrid 4
  • Add option for a scatter-chart series

    Add option for a scatter-chart series

    This update adds the ability to add a series of small circles, either for a scatter plot or to highlight specific points on a line graph. It also provides for a few more variables in the series to control how the graph displays.

    opened by mariohendricks 0
  • How to set close day dashed line and gradient support

    How to set close day dashed line and gradient support

    Hi fellow developer!

    Before sending an issue, please consider Stack Overflow. Tag your question with swiftcharts: http://stackoverflow.com/tags/swiftcharts/info.

    Also, check https://github.com/gpbl/SwiftChart#common-issues-and-solutions

    Thanks!

    opened by mohdtahir-kiwi 0
  • X,y Label Position outside the grid

    X,y Label Position outside the grid

    Hi fellow developer!

    Before sending an issue, please consider Stack Overflow. Tag your question with swiftcharts: http://stackoverflow.com/tags/swiftcharts/info.

    Also, check https://github.com/gpbl/SwiftChart#common-issues-and-solutions

    Thanks!

    opened by mohdtahir-kiwi 0
  • Labels appearing on left side of x Axis

    Labels appearing on left side of x Axis

    Hi, I am trying to add some labels on the x Axis for the amount of hours before the present moment, like so:

    chart.xlabels = [-24, -21, -18, -15, -12, -9, -6, -3, 0]

    However, when I run my code, I get something that looks like this:

    image

    Is it normal that I can't configure the positioning of these labels? Thanks.

    opened by lburch02 1
Releases(1.0.0)
  • 1.0.0(Jan 7, 2018)

    • Breaking change: Use Double instead of Float (#87 by @trein)
    • Added: Initialize a serie with Int x-values
    • Fixed: crash when using empty series data (#88 by @trein)
    Source code(tar.gz)
    Source code(zip)
  • 0.6.0(Jan 6, 2018)

  • 0.5.0(May 20, 2017)

    • Automatically redraw the chart when changing series (#25 by @duemunk): no need to call setNeedsDisplay when changing chart's series property
    • Update chart on resize (#24 by @duemunk)
    • Add xLabelsOrientation option to switch the x-labels orientation between horizontal or vertical (#61)
    • Add xLabelsSkipLast option. Set it to false to print the last x-label (the last labe; may overflow the frame size, tough) (#37)
    Source code(tar.gz)
    Source code(zip)
  • 0.4.0(Nov 14, 2016)

    • Add custom threshold for positive/negative data colors (#45 by @algrid)

    This is a potentially breaking change If you were setting the ChartSeries.colors, you must set the new zeroLevel value to 0 to keep the same functionality:

    - mySeriesl.colors = (above: ChartsColors.redColor(), below: ChartsColors.blueColor())
    + mySeriesl.colors = (above: ChartsColors.redColor(), below: ChartsColors.blueColor(), 0)
    
    Source code(tar.gz)
    Source code(zip)
  • 0.3.0(Sep 26, 2016)

    This release upgrades the source code and examples to Swift 3.

    Breaking changes

    • Chart.addSeries(series: ChartSeries) method has been renamed to Chart.add(series: ChartSeries)
    Source code(tar.gz)
    Source code(zip)
  • 0.2.2(Jul 6, 2016)

  • 0.2.1(Feb 14, 2016)

  • 0.2.0(Dec 12, 2015)

  • 0.1.0(Dec 4, 2015)

Owner
Giampaolo Bellavite
🤖❤️🐕
Giampaolo Bellavite
iOS-based charting library for both line and bar graphs.

JBChartView Introducing JBChartView - Jawbone's iOS-based charting library for both line and bar graphs. It is easy to set-up, and highly customizable

Jawbone 3.8k Jan 1, 2023
Elegant Line Graphs for iOS. (Charting library)

BEMSimpleLineGraph BEMSimpleLineGraph makes it easy to create and customize line graphs for iOS. BEMSimpleLineGraph is a charting library that makes i

Boris Emorine 2.7k Dec 26, 2022
A charting library to visualize and interact with a vector map on iOS. It's like Geochart but for iOS!

FSInteractiveMap A charting library to visualize data on a map. It's like geochart but for iOS! The idea behind this library is to load a SVG file of

Arthur 544 Dec 30, 2022
Declarative charting and visualization to use with SwiftUI

Chart Declarative charting and visualization to use with SwiftUI The package is in open development with a goal of making a declara

null 11 Jun 3, 2022
iOS Chart. Support animation, click, scroll, area highlight.

XJYChart XJYChart - A High-performance, Elegant, Easy-to-integrate Charting Framework. The Best iOS Objc Charts. chart more beautiful support chart sc

junyixie 868 Nov 16, 2022
A powerful 🚀 Android chart view / graph view library, supporting line- bar- pie- radar- bubble- and candlestick charts as well as scaling, panning and animations.

⚡ A powerful & easy to use chart library for Android ⚡ Charts is the iOS version of this library Table of Contents Quick Start Gradle Maven Documentat

Philipp Jahoda 36k Jan 5, 2023
Simple iOS Application built using UIKit displaying the list of Cryptocurrencies and a detailed screen with a line graph.

CryptoViewer Simple iOS Application built using UIKit displaying the list of Cryptocurrencies and a detailed screen with a line graph. Home Screen: Di

null 0 Jun 14, 2022
FSLineChart A line chart library for iOS.

FSLineChart A line chart library for iOS. Screenshots Installing FSLineChart Add the contents of the FSLineChart project to your directory or simply a

Arthur 856 Nov 24, 2022
Line Chart library for iOS written in Swift

Swift LineChart Usage var lineChart = LineChart() lineChart.addLine([3, 4, 9, 11, 13, 15]) Features Super simple Highly customizable Auto scaling Touc

Mirco Zeiss 601 Nov 15, 2022
Demonstrate a way to build your own line chart without using any third-party library

LineChart This code demonstrate a way to build your own line chart without using any third-party library. It contains a simple yet effective algorithm

Van Hung Nguyen 0 Oct 17, 2021
Line plot like in Robinhood app in SwiftUI

RHLinePlot Line plot like in Robinhood app, in SwiftUI Looking for how to do the moving price label effect? Another repo here. P.S. Of course this is

Wirawit Rueopas 234 Dec 27, 2022
ANDLineChartView is easy to use view-based class for displaying animated line chart.

ANDLineChartView for iOS ANDLineChartView is easy to use view-based class for displaying animated line chart. Usage API is simple. Just implement foll

Andrzej Naglik 421 Dec 11, 2022
An interactive line chart written in SwiftUI with many customizations.

LineChartView LineChartView is a Swift Package written in SwiftUI to add a line chart to your app. It has many available customizations and is interac

Jonathan Gander 59 Dec 10, 2022
Fully customizable line chart for SwiftUI 🤩

?? CheesyChart Create amazing Crypto and Stock charts ?? ?? Looking for an easy to use and fully customizable charting solution written in SwiftUI? Th

adri567 13 Dec 14, 2022
Simple and intuitive iOS chart library. Contribution graph, clock chart, and bar chart.

TEAChart Simple and intuitive iOS chart library, for Pomotodo app. Contribution graph, clock chart, and bar chart. Supports Storyboard and is fully ac

柳东原 · Dongyuan Liu 1.2k Nov 29, 2022
A simple and beautiful chart lib used in Piner and CoinsMan for iOS(https://github.com/kevinzhow/PNChart) Swift Implementation

PNChart-Swift PNChart(https://github.com/kevinzhow/PNChart) Swift Implementation Installation This isn't on CocoaPods yet, so to install, add this to

Kevin 1.4k Nov 7, 2022
A simple and beautiful chart lib used in Piner and CoinsMan for iOS

PNChart You can also find swift version at here https://github.com/kevinzhow/PNChart-Swift A simple and beautiful chart lib with animation used in Pin

Kevin 9.8k Jan 6, 2023
A simple and animated Pie Chart for your iOS app.

XYPieChart XYPieChart is an simple and easy-to-use pie chart for iOS app. It started from a Potion Project which needs an animated pie graph without i

XY Feng 1.7k Sep 6, 2022
SwiftCharts - Easy to use and highly customizable charts library for iOS

SwiftCharts Easy to use and highly customizable charts library for iOS Features: Bars - plain, stacked, grouped, horizontal, vertical Scatter Lines (s

Ivan Schütz 2.4k Jan 4, 2023