iOS-based charting library for both line and bar graphs.

Related tags

Charts JBChartView
Overview

JBChartView


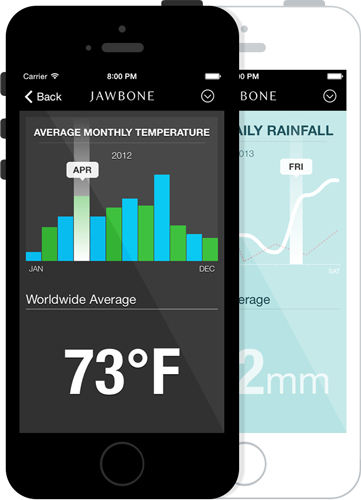
Introducing JBChartView - Jawbone's iOS-based charting library for both line and bar graphs. It is easy to set-up, and highly customizable.

Features

  • Drop-in UIView subclass supported across all devices.
  • Line and bar graph support.
  • Simple to use protocols modeled after a UITableView.
  • Highly customizable.
  • Expand & collapse animation support.

Refer to the <a href="https://github.com/Jawbone/JBChartView/blob/master/CHANGELOG.md"">changelog for an overview of JBChartView's feature history.

Requirements

  • Requires iOS 6 or later
  • Requires Automatic Reference Counting (ARC)

Demo Project

Build and run the JBChartViewDemo project in Xcode. The demo demonstrates the use of both the line and bar charts. It also outlines how a chart's appearance can be customized.

More Demos

  • Amsombe's Quartet: project showcasing the use of JBChartView in the classic data visualization example known as Anscombe's Quartet.
  • Spark Friends: project showcasing the use of JBChartView in the context of sparklines and (fake) user step data.

Installation

CocoaPods is the recommended method of installing JBChartView.

The Pod Way

Simply add the following line to your Podfile:

platform :ios, '6.0'
pod 'JBChartView'

The Old School Way

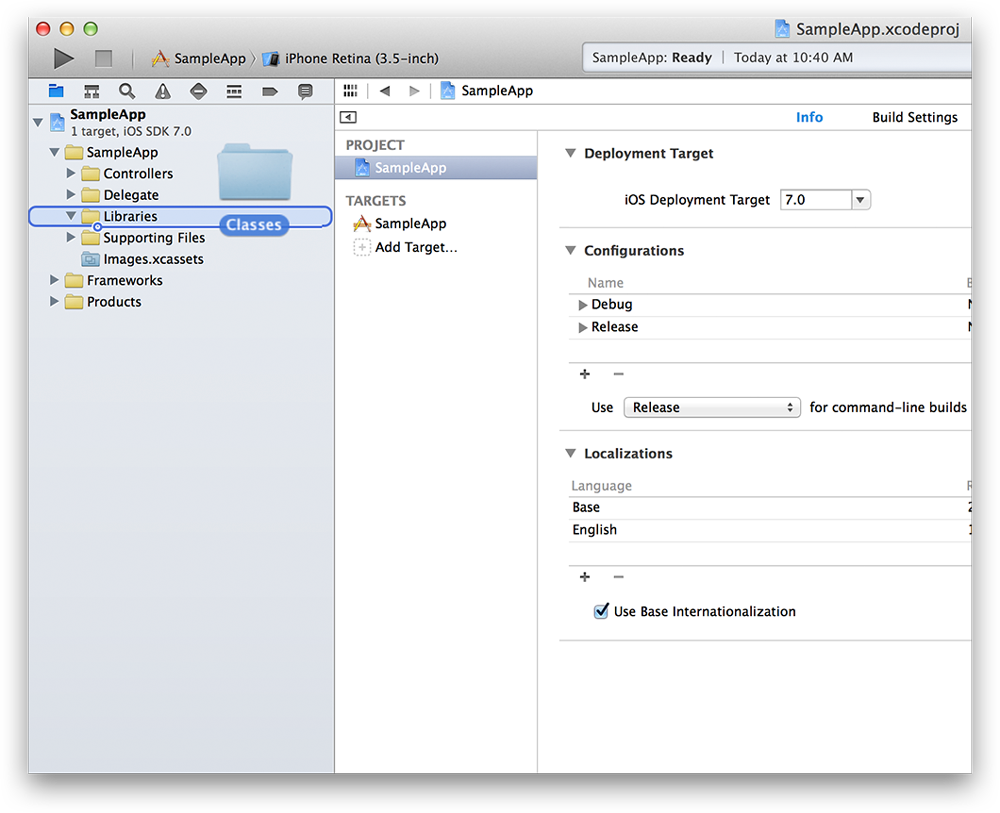
The simplest way to use JBChartView with your application is to drag and drop the /Classes folder into you're Xcode 5 project. It's also recommended you rename the /Classes folder to something more descriptive (ie. "Jawbone - JBChartView").

Usage

All JBChartView implementations have a similiar data source and delgate pattern to UITableView. If you're familiar with using a UITableView or UITableViewController, using a JBChartView subclass should be a breeze!

Swift Projects

To use JBCartView in a Swift project add the following to your bridging header (JBChartView-Bridging-Header.h):

#import <UIKit/UIKit.h>
#import "JBChartView.h"
#import "JBBarChartView.h"
#import "JBLineChartView.h"

For more information about adding bridging headers see Swift and Objective-C in the Same Project.

JBBarChartView

To initialize a JBBarChartView, you only need a few lines of code (see below). Bar charts can also be initialized via a nib or with a frame.

JBBarChartView *barChartView = [[JBBarChartView alloc] init];
barChartView.dataSource = self;
barChartView.delegate = self;
[self addSubview:barChartView];

Just like you would for a UITableView, ensure you clear these properties in your dealloc:

- (void)dealloc
{
	JBBarChartView *barChartView = ...; // i.e. _barChartView
	barChartView.delegate = nil;
	barChartView.dataSource = nil;
}

At a minimum, you need to inform the data source how many bars are in the chart:

- (NSUInteger)numberOfBarsInBarChartView:(JBBarChartView *)barChartView
{
	return ...; // number of bars in chart
}

Secondly, you need to inform the delegate the height of each bar (automatically normalized across the entire chart):

- (CGFloat)barChartView:(JBBarChartView *)barChartView heightForBarViewAtIndex:(NSUInteger)index
{
	return ...; // height of bar at index
}

Lastly, ensure you have set the frame of your barChartView & call reloadData at least once:

barChartView.frame = CGRectMake( ... );
[barChartView reloadData];

Subsequent changes to the chart's frame will not invoke reloadData; it must be called directly afterwards for any changes to take effect.

Animated Reload

Both line and bar charts support animated reloads. The delta between the old data model and new data model is calculated and animated appropriately (ie. bars or lines will shrink, expand or morph in size). Due to techinical limitations in Apple's Quartz Core Framework, line fills (both solid and gradient) can not be animated - they will simply 'snap' into place while the rest of the chart continues to animate.

- (void)reloadDataAnimated:(BOOL)animated;

State changes during a reload will be ignored. As well, subsequent calls to reloadData: or reloadDataAnimated: before any previous reloads are complete, will also be ignored. Lastly, all touch events will be ignored until a reload has completed. You can always check on the state of the animation via the exposed read-only property:

@property (nonatomic, readonly) BOOL reloading;

By default, the animation will complete in approximately 0.25 seconds. The animation duration is independent from the data model size.

Note: the above restrictions apply only to animated reloads, as non-animated reloads are synchronous.

JBLineChartView

Similiarily, to initialize a JBLineChartView, you only need a few lines of code (see below). Line charts can also be initialized via a nib or with a frame.

JBLineChartView *lineChartView = [[JBLineChartView alloc] init];
lineChartView.dataSource = self;
lineChartView.delegate = self;
[self addSubview:lineChartView];

Just like you would for a UITableView, ensure you clear these properties in your dealloc:

- (void)dealloc
{
	JBLineChartView *lineChartView = ...; // i.e. _lineChartView
	lineChartView.delegate = nil;
	lineChartView.dataSource = nil;
}

At a minimum, you need to inform the data source how many lines and vertical data points (for each line) are in the chart:

- (NSUInteger)numberOfLinesInLineChartView:(JBLineChartView *)lineChartView
{
	return ...; // number of lines in chart
}

- (NSUInteger)lineChartView:(JBLineChartView *)lineChartView numberOfVerticalValuesAtLineIndex:(NSUInteger)lineIndex
{
	return ...; // number of values for a line
}

Secondly, you need to inform the delegate of the y-position of each point (automatically normalized across the entire chart) for each line in the chart:

- (CGFloat)lineChartView:(JBLineChartView *)lineChartView verticalValueForHorizontalIndex:(NSUInteger)horizontalIndex atLineIndex:(NSUInteger)lineIndex
{
	return ...; // y-position (y-axis) of point at horizontalIndex (x-axis)
}

Note: you can return NAN instead of CGFloat to indicate missing values. The chart's line will begin at the first non-NAN value and end at the last non-NAN value. The line will interopolate any NAN values in between (ie. the line will not be interrupted).

return [[NSNumber numberWithFloat:NAN] floatValue];

Lastly, ensure you have set the frame of your lineChartView & call reloadData at least once:

lineChartView.frame = CGRectMake( ... );
[lineChartView reloadData];

Note: subsequent changes to the chart's frame will not invoke reloadData; it must be called directly afterwards for any changes to take effect.

Customization

Both the line and bar charts support a robust set of customization options. Read more about them here.

Minimum & Maximum Values

By default, a chart's minimum and maximum values are equal to the min and max supplied by the dataSource. You can override either value via:

- (void)setMinimumValue:(CGFloat)minimumValue;
- (void)setMaximumValue:(CGFloat)maximumValue;

If value(s) are supplied, they must be >= 0, otherwise an assertion will be thrown. To reset the values back to their original defaults:

- (void)resetMinimumValue;
- (void)resetMaximumValue;

The min/max values are clamped to the ceiling and floor of the actual min/max values of the chart's data source; for example, if a maximumValue of 20 is supplied & the chart's actual max is 100, then 100 will be used. For min/max modifications to take effect, reloadData must be called.

Performance

The nature of charting is to display all available information, unlike a UITableView, which can cache rows that are offscreen. JBChartView's performance will suffer if the number of data points exceed the resolution of the device. The same issue exists with MKMapView, when hundreds of pins are supplied within a certain geographic area. It's why Apple recommends clustering to avoid performance issues. As such, for large datasets, we recommend that your dataSource to supply a subset of points; clustering those that are close to one another.

License

Usage is provided under the Apache License (v2.0). See LICENSE for full details.

Comments
  • Following the tutorial creates an empty/blank view

    Following the tutorial creates an empty/blank view

    I followed the tutorial to create the bar chart, and the result was an empty screen. I am assuming the problem is in the initialization code:

    JBBarChartView *barChartView = [[JBBarChartView alloc] init];
    

    Can someone double check this and see if they can reproduce the issue on an empty project?

    opened by zkhalapyan 17
  • Using minimum of 0 as default

    Using minimum of 0 as default

    After I updated to the current version I got really confused with a BarChart having a minimum value above 0. In the earlier version 0 was used as the base value for bar height calculation. In the current version the lowest number is used. (Bar with 10, 20, 40 on 40px is shown with heights of 0px, 10px, 40px - not my expected 10px, 20px, 40px). It took some time until I figured out why this happened.

    However, I think using 0 as default minimum value is what you would expect using a JBBarChart and therefore should be the default setting.

    Btw: great tool and keep on with constant improvements!

    opened by simonnickel 15
  • Added area diagram functionality

    Added area diagram functionality

    Hello

    I like JBchartView, but I missed the possibility to fill the area under the lines to create a area diagram so I added it. I also added the area diagram to the sample.

    I tried to follow the code style of the rest of the porject.

    screenshot 2014 04 22 16 58 09

    enhancement 
    opened by hackingotter 14
  • Crash, lineChartView

    Crash, lineChartView "must implement numberOfPointsInLineChartView" ?

    ** Terminating app due to uncaught exception 'NSInternalInconsistencyException', reason: 'JBLineChartView // dataSource must implement - (NSInteger)numberOfPointsInLineChartView:(JBLineChartView *)lineChartView'

    I'm on the latest version (2.2) and I implemented the methods:

    • (NSUInteger)numberOfLinesInLineChartView:(JBLineChartView *)lineChartView;
    • (NSUInteger)lineChartView:(JBLineChartView *)lineChartView numberOfVerticalValuesAtLineIndex:(NSUInteger)lineIndex;

    I tried adding numberOfPointsInLineChartView... but it didn't help and I don't think that method is used anymore...

    I must be doing something wrong...

    opened by simonbromberg 12
  • need Swift implementation details and example

    need Swift implementation details and example

    Hi, I am trying to use it in a swift project. however I am having a hard time getting it to work.

    will it be possible to show an example or list step by step documentation instructions to make it work on a swift project

    enhancement 
    opened by NicolaZordan 10
  • JBLineChartView: wrong width on iPhone6/6+

    JBLineChartView: wrong width on iPhone6/6+

    I have JBLineChartView inside UITableViewCell which is inserted in UITableView after the touch on another UITableViewCell. When the cell is displayed for the first time it has wrong width on iPhone6/6+. Later it look OK. If I put ordinary UIView instead of JBLineChartView everything works fine.

    Any idea what could be the reason?

    Thanks.

    bad ok

    opened by va1da 9
  • Allowed to use negative values

    Allowed to use negative values

    I can confirm that everything looks fine if there no negative values — so this can't break anything in the projects that rely on JBChartView. Line graph with negative values looks fine and just as expected. Bar chart looks a bit frustrating — because bars grow from the minimum point and not from zero. This closes #102

    opened by ReDetection 9
  • NSInternalInconsistencyException - JBLineChartView // dataSource must implement

    NSInternalInconsistencyException - JBLineChartView // dataSource must implement

    I've been using JBLineChartView and it has been working great, but now I'm getting this error:

    *** Assertion failure in -[JBLineChartView padding], /Users/Psycho/Work/ios/bluewave/Pods/JBChartView/Classes/JBLineChartView.m:411
    *** Terminating app due to uncaught exception 'NSInternalInconsistencyException', reason: 'JBLineChartView // dataSource must implement - (NSUInteger)numberOfLinesInLineChartView:(JBLineChartView *)lineChartView'
    *** First throw call stack:
    (0x309fafd3 0x3b145ccf 0x309faead 0x313a7d5b 0x76f3b 0x746c7 0x3631b 0x33349917 0x332f0c47 0x332f049d 0x33216d79 0x32e9462b 0x32e8fe3b 0x3322beab 0x33c03 0x3321b4cb 0x3321b289 0x333a738b 0x332c4d83 0x332c4b8d 0x332c4b25 0x33216d79 0x32e9462b 0x32e8fe3b 0x32e8fccd 0x32e8f6df 0x32e8f4ef 0x3321a401 0x309c625b 0x309c572b 0x309c3f1f 0x3092ef0f 0x3092ecf3 0x35850663 0x3327a16d 0x126c5 0x3b652ab7)
    libc++abi.dylib: terminating with uncaught exception of type NSException
    

    The flow of my app is something like this:

    • I've four UIViewControllers in a Navigation Controller (All push segues) for
      • Year Selection
      • Month Selection (has charts)
      • Day Selection (has charts)
      • Day Details
    • Month and Day Selection UIViewControllers have JBLineChartViews
    • When I select a year, and go into Month Selection the Charts works perfectly
    • If I go further down into Day Selection, the charts works again
    • Now, if I go back to the first ViewController (Pop the views) and repeat the procedure (i.e. Go into Month Selection and Day Selection), the app crashes as soon as the Day Selection View is loaded with the above error.

    I can't understand why is this happening, even though I implemented the above mentioned method and the chart loads in Month Selection the second time (but not in the Day Selection).

    Here are the JBLineChartView delegate and datasource methods in my Day Selection View Controller: screen shot 2014-06-24 at 4 55 23 pm

    opened by sheharyarn 9
  • Add ability to have the line start or end at any given point

    Add ability to have the line start or end at any given point

    This pull requests adds the ability to have the line start or end at any given point. Now lineChartView: verticalValueForHorizontalIndex: atLineIndex: can return NAN as a value and the line starts at the first non-nan value and ends at the last non-nan value.

    i also added an example.

    opened by sebastianreloaded 8
  • Curved line charts

    Curved line charts

    Wanted to see what you guys think of the possible option for curved/smooth line charts? Or if you have already consider it?

    Either way, love what you're doing with this. Working great.

    (This can be marked as an enhancement)

    enhancement 
    opened by ryancoughlin 8
  • XCode 6.3 with Swift 1.2 error

    XCode 6.3 with Swift 1.2 error

    Hi, i'm try to use JBChart into my project with XCode 6.3 and Swift (1.2). I've follow your installation tutorial and all work fine, but on my ViewController i've this error:

    ChartViewController.swift:31:30: Cannot assign a value of type 'ChartViewController' to a value of type 'JBBarChartViewDelegate!'

    and

    ChartViewController.swift:32:32: Cannot assign a value of type 'ChartViewController' to a value of type 'JBBarChartViewDataSource!'

    This are the lines:

    lineChart.delegate = self lineChart.dataSource = self

    Where are my errors?

    Thanks a lot and congratulations for great job!

    question 
    opened by mitsus 7
  • fix warnings and update to current settings

    fix warnings and update to current settings

    • auto updated the project settings
    • resolved warning for deprecated font method
    • resolved warning of block usage (same as https://github.com/Jawbone/JBChartView/pull/234)
    opened by simonnickel 3
  • Updated XCode, now bar chart incorrectly loads data and bars are invisible

    Updated XCode, now bar chart incorrectly loads data and bars are invisible

    No changes to my code, but after XCode update the bar chart behaves strangely.

    PRIOR to Update

    • Bar chart loaded with one week's worth of data on viewDidLoad.

    AFTER Update

    • Bar chart loads one week minus a day (six bars instead of 7)
    • Bars are invisible, touching on chart does not show white highlight but does register touch and drag (I have labels updating with data points, similar to your demo app on weather).
    • Switching to month and back to week via a segmented controller on my VC correctly loads bars and 7 days of data, all views are visible.

    reloadData() is called at launch, and all delegate methods are returning correct values (numberOfBars returns 7, heightForBar returns data for the "missing" 7th day), but still there only 6 invisible bars in the chartView.

    opened by dancemonkey 1
  • While calling chartBar.reloadData() app gets crashed

    While calling chartBar.reloadData() app gets crashed

    Thanks for good library. I am using this in my swift project. But, I added this bar chart view to my tableview cell to display in tableview cell. But, while calling chartBar.reloadData(), its getting crashed and graph not displaying, can you help me to fix this?

    Thanks

    opened by AnilkumarRabhasa 0
  • Bug Fix

    Bug Fix

    Bug Reappear Steps:

    1. Change data source .
    2. Use reloadDataAnimated:YES to update line.
    3. Use screen edge pan gesture pop to previous view controller.
    4. Bug appeared! The chart view will presenting previous line.
    opened by developforapple 0
Owner
Jawbone
Jawbone
SwiftUICharts - A simple line and bar charting library that supports accessibility written using SwiftUI.

SwiftUICharts - A simple line and bar charting library that supports accessibility written using SwiftUI.

Majid Jabrayilov 1.4k Jan 9, 2023
SwiftChart - A simple line and area charting library for iOS.

SwiftChart A simple line and area charting library for iOS. ?? Line and area charts ?? Multiple series ?? Partially filled series ?? Works with signed

Giampaolo Bellavite 1k Jan 2, 2023
A charting library to visualize and interact with a vector map on iOS. It's like Geochart but for iOS!

FSInteractiveMap A charting library to visualize data on a map. It's like geochart but for iOS! The idea behind this library is to load a SVG file of

Arthur 544 Dec 30, 2022
Declarative charting and visualization to use with SwiftUI

Chart Declarative charting and visualization to use with SwiftUI The package is in open development with a goal of making a declara

null 11 Jun 3, 2022
Easily create graphs that calculate percentiles

SwiftUIPercentChart Easily create graphs that calculate percentiles How to install this package Open your project on Xcode Go to Project Tab and selec

Mehmet ateş 4 Jul 13, 2022
A powerful 🚀 Android chart view / graph view library, supporting line- bar- pie- radar- bubble- and candlestick charts as well as scaling, panning and animations.

⚡ A powerful & easy to use chart library for Android ⚡ Charts is the iOS version of this library Table of Contents Quick Start Gradle Maven Documentat

Philipp Jahoda 36k Jan 5, 2023
ANDLineChartView is easy to use view-based class for displaying animated line chart.

ANDLineChartView for iOS ANDLineChartView is easy to use view-based class for displaying animated line chart. Usage API is simple. Just implement foll

Andrzej Naglik 421 Dec 11, 2022
Simple and intuitive iOS chart library. Contribution graph, clock chart, and bar chart.

TEAChart Simple and intuitive iOS chart library, for Pomotodo app. Contribution graph, clock chart, and bar chart. Supports Storyboard and is fully ac

柳东原 · Dongyuan Liu 1.2k Nov 29, 2022
MSBBarChart is an easy to use bar chart library for iOS

MSBBarChart MSBBarChart is an easy to use bar chart library for iOS. Usage if you want to hide label above bar barChart.setOptions([.isHiddenLabelAbov

misyobun 45 May 3, 2022
FSLineChart A line chart library for iOS.

FSLineChart A line chart library for iOS. Screenshots Installing FSLineChart Add the contents of the FSLineChart project to your directory or simply a

Arthur 856 Nov 24, 2022
Line Chart library for iOS written in Swift

Swift LineChart Usage var lineChart = LineChart() lineChart.addLine([3, 4, 9, 11, 13, 15]) Features Super simple Highly customizable Auto scaling Touc

Mirco Zeiss 601 Nov 15, 2022
Demonstrate a way to build your own line chart without using any third-party library

LineChart This code demonstrate a way to build your own line chart without using any third-party library. It contains a simple yet effective algorithm

Van Hung Nguyen 0 Oct 17, 2021
Simple iOS Application built using UIKit displaying the list of Cryptocurrencies and a detailed screen with a line graph.

CryptoViewer Simple iOS Application built using UIKit displaying the list of Cryptocurrencies and a detailed screen with a line graph. Home Screen: Di

null 0 Jun 14, 2022
SwiftUI Bar Chart

SwiftUI BarChart Lightweight and easy to use SwiftUI chart library for all Apple platforms Features Scaling on both axes Fully customizable axes (labe

Roman Baitaliuk 158 Jan 6, 2023
Draw a chart with progress bar style

ChartProgressBar-iOS Draw a chart with progress bar style - the android version here Installation iOS version (9.0,*) Swift 3.2 Using cocoapods : pod

Hadi Dbouk 84 Apr 25, 2022
Repository with example app for using Bar chart

Gráfico de Barras (Exemplo) Repositório com app exemplo para o uso do gráfico de Barras. O gráfico de barras é um gráfico com barras retangulares e co

Felipe Leite 0 Nov 5, 2021
Line plot like in Robinhood app in SwiftUI

RHLinePlot Line plot like in Robinhood app, in SwiftUI Looking for how to do the moving price label effect? Another repo here. P.S. Of course this is

Wirawit Rueopas 234 Dec 27, 2022
An interactive line chart written in SwiftUI with many customizations.

LineChartView LineChartView is a Swift Package written in SwiftUI to add a line chart to your app. It has many available customizations and is interac

Jonathan Gander 59 Dec 10, 2022
Fully customizable line chart for SwiftUI 🤩

?? CheesyChart Create amazing Crypto and Stock charts ?? ?? Looking for an easy to use and fully customizable charting solution written in SwiftUI? Th

adri567 13 Dec 14, 2022