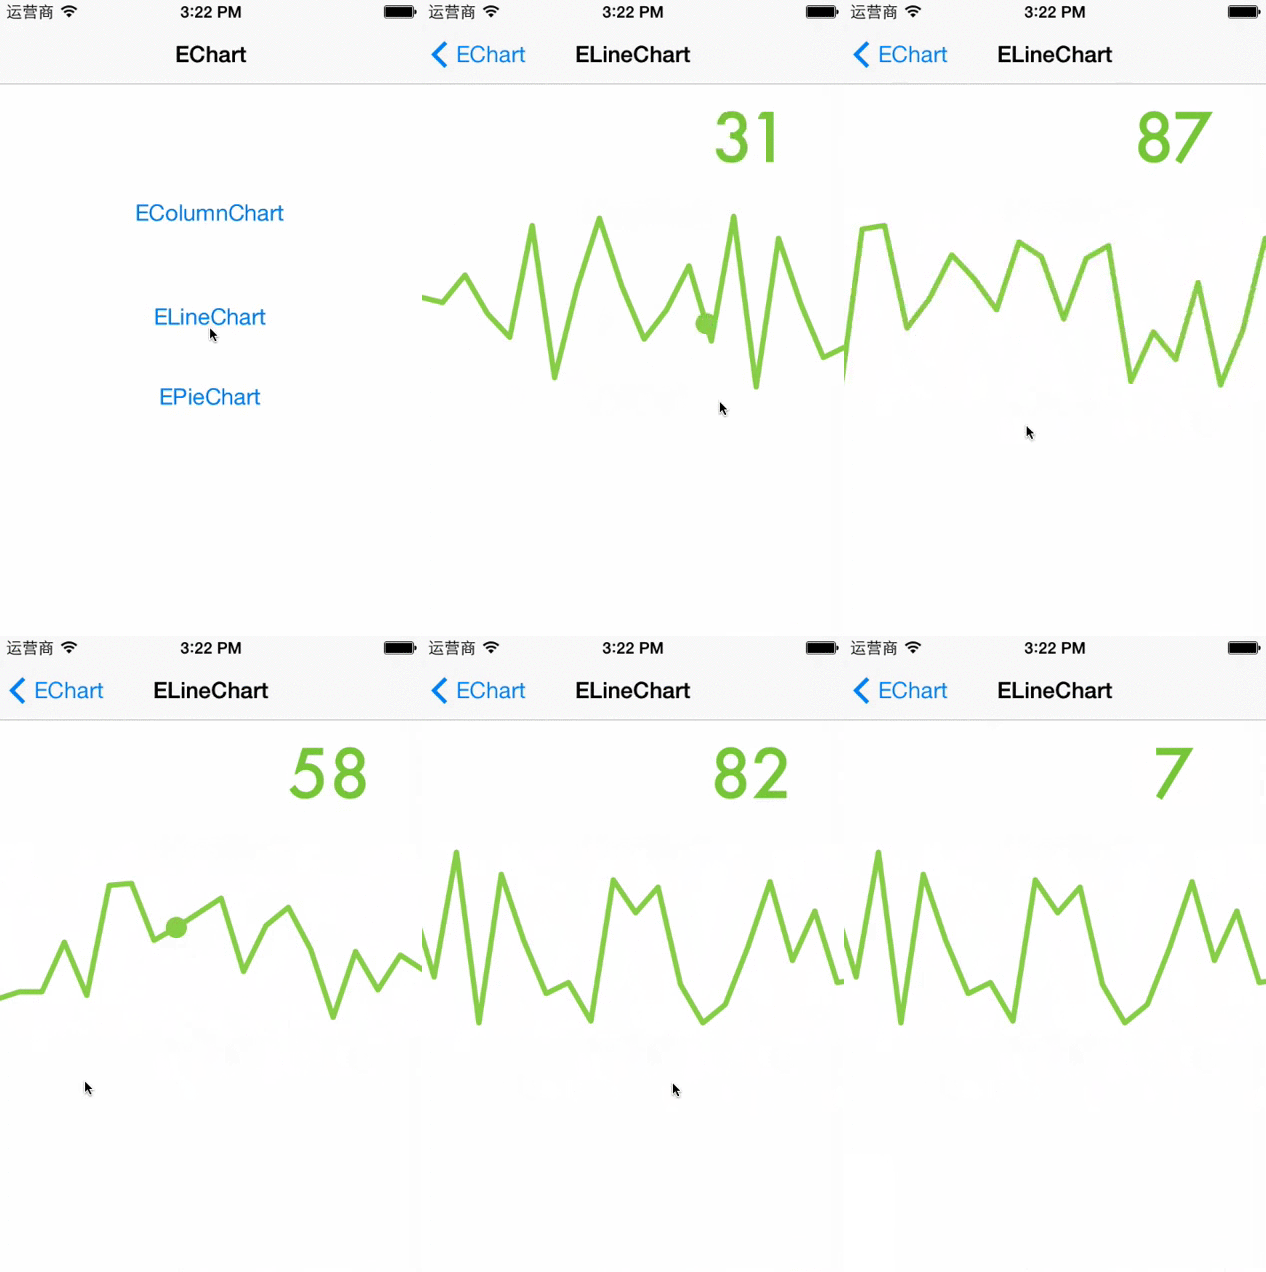
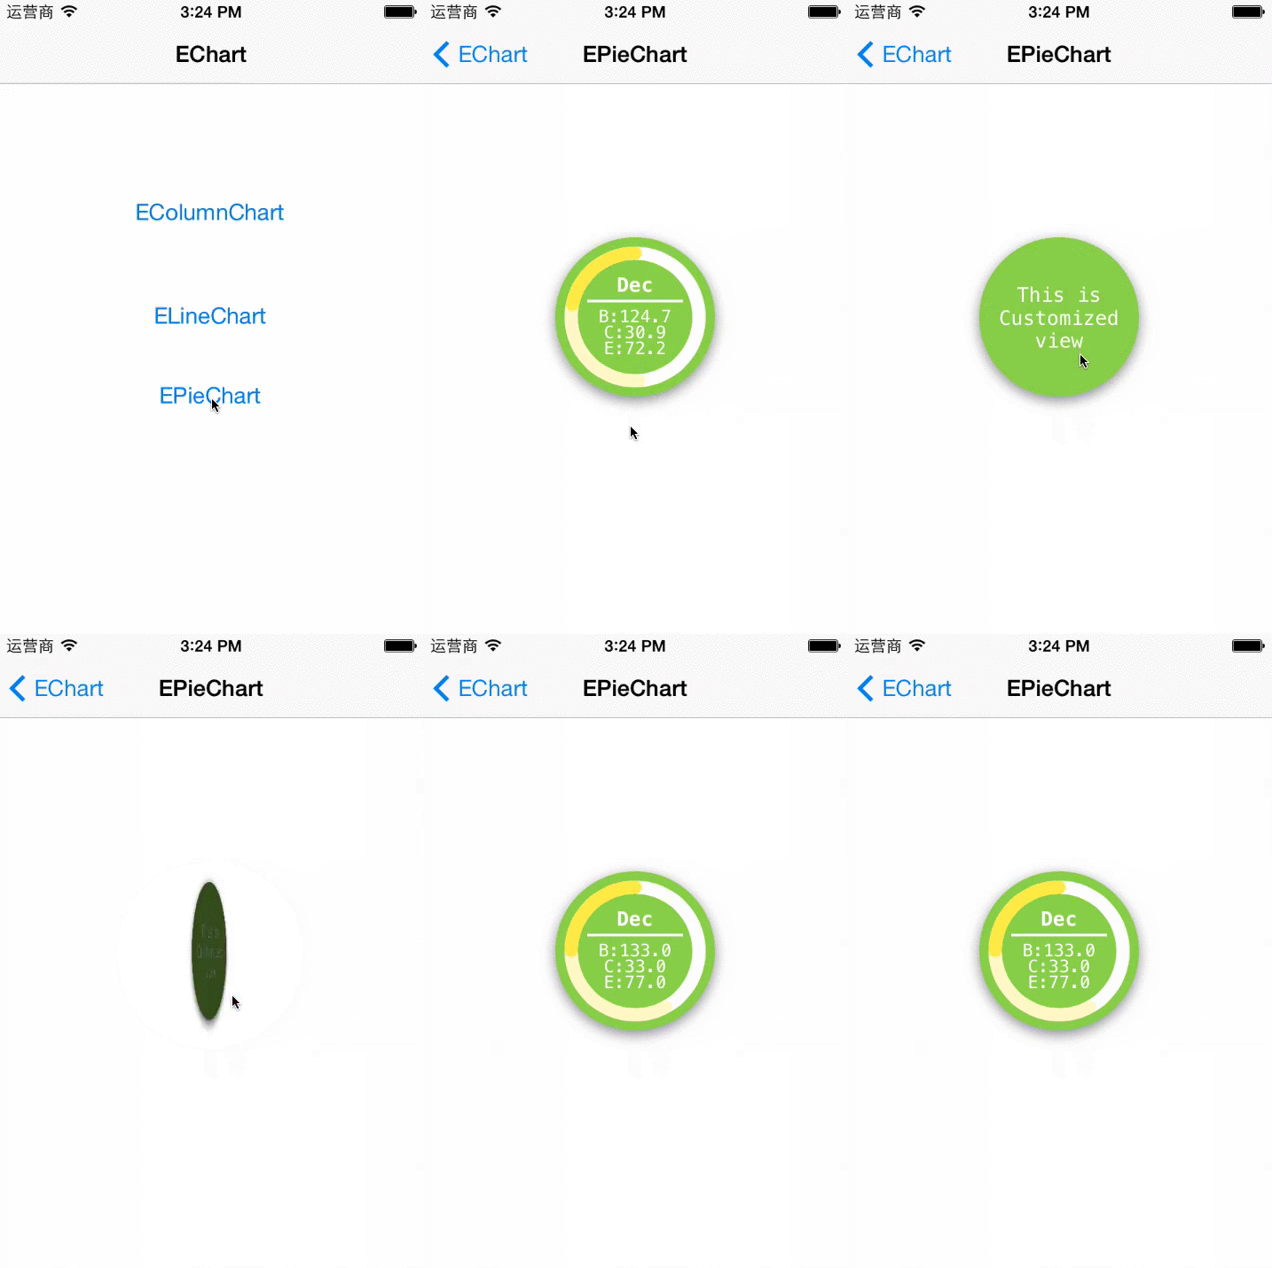
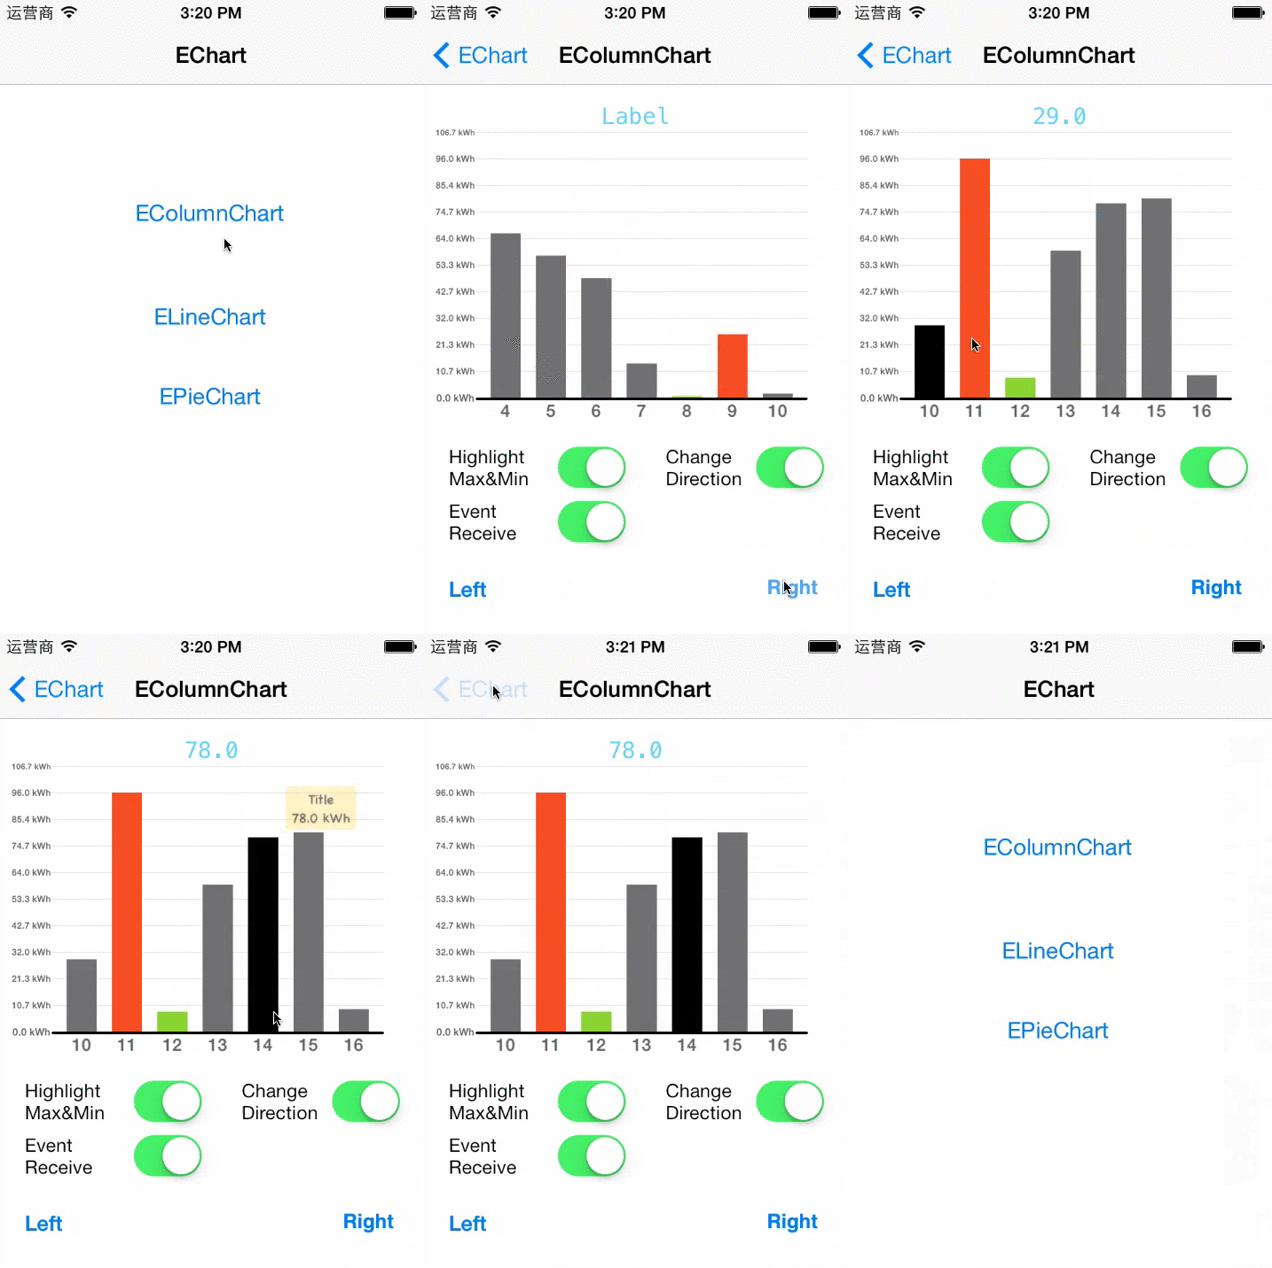
iOS/iPhone/iPad Chart, Graph. Event handling and animation supported.

Related tags

Charts EChart
Overview

#EChart A highly extendable, easy to use chart with event handling, animation supported.

##Test

How To Use

Download and run the EChartDemo project is the best practice to know how to use EChart.

Step 1: Add EChart to Your Project

use CocoaPods with Podfile:

platform :ios, '7.0'
pod "EChart"

or Download project here

And Drag /EChart/ folder into your project

Step 2: Include ECharts in your View Controller

EColumnChart as a example, all ECharts work in a similar way.

Import the head file:

#import "EColumnChart.h"

Make your ViewController adopts the EColumnChart's protocol:

@interface YourViewController : UIViewController <EColumnChartDelegate, EColumnChartDataSource>

Declare a EColumnChart instance:

@property (strong, nonatomic) EColumnChart *eColumnChart;

Step 3

Give your EColumnChart a nice frame:

_eColumnChart = [[EColumnChart alloc] initWithFrame:CGRectMake(40, 100, 250, 200)];

Set EColumnChart's delegate and dataSource to your ViewController:

[_eColumnChart setDelegate:self];
[_eColumnChart setDataSource:self];

Add EColumnChart to wherever you want:

[self.view addSubview:_eColumnChart];

Provide data & Get events

After setting up your EColumnChart, you may need to provide the data for the EColumnChart and you will be able to get events from EColumnChart as well.

If you were a expert with UITableView, you will be quite familiar with the way EColumnChart works. Because they work in a same way.

DataSource

You need to implement every method in the EColumnChartDataSource

/** How many Columns are there in total.*/
- (NSInteger) numberOfColumnsInEColumnChart:(EColumnChart *) eColumnChart;

/** How many Columns should be presented on the screen each time*/
- (NSInteger) numberOfColumnsPresentedEveryTime:(EColumnChart *) eColumnChart;

/** The highest value among the whole chart*/
- (EColumnDataModel *)     highestValueEColumnChart:(EColumnChart *) eColumnChart;

/** Value for each column*/
- (EColumnDataModel *)     eColumnChart:(EColumnChart *) eColumnChart
                    valueForIndex:(NSInteger)index;

EColumnChartDelegate

The implementation of the Delegate is according to your needs

/** When finger single taped the column*/
- (void)        eColumnChart:(EColumnChart *) eColumnChart
         didSelectColumn:(EColumn *) eColumn;

/** When finger enter specific column, this is dif from tap*/
- (void)        eColumnChart:(EColumnChart *) eColumnChart
    fingerDidEnterColumn:(EColumn *) eColumn;

/** When finger leaves certain column, will tell you which column you are leaving*/
- (void)        eColumnChart:(EColumnChart *) eColumnChart
    fingerDidLeaveColumn:(EColumn *) eColumn;

/** When finger leaves wherever in the chart, will trigger both if finger is leaving from a column */
- (void) fingerDidLeaveEColumnChart:(EColumnChart *)eColumnChart;

#License EChart is available under the Apache License. See the LICENSE file for more info..
Comments
  • Chart does not move left

    Chart does not move left

    moveRight seems to be working just fine. But moveLeft does not do anything.

    I am using a pod file to add EColumnChart, my entry is as below : platform :ios, '7.0' pod 'EChart'

    opened by hightitude 4
  • Not possible to set that left axis should stick to whole integers

    Not possible to set that left axis should stick to whole integers

    Really nice framework, working on adding it to my app. Though i stumbled onto a problem, a feature request. I want the left lines only to stick to whole values.

    For example my app has a graph of how many correct answer a user has gotten per day over last week. Does not make sense to have 13.1 answers, 15.4 answers as the labels for the lines. It would be great if the lines could stick to whole values.

    enhancement 
    opened by haaakon 4
  • NormalColumnColor is bypassed

    NormalColumnColor is bypassed

    Hi again, I was wondering why setting normalColumnColor for the chart view has no effect on their appearance and then I reviewed your code and I noticed that normalColumnColor is completely bypassed by EGrey!

    My solution: eColumn.barColor = _normalColumnColor?_normalColumnColor:EGrey; in the reloadData

    opened by mohpor 1
  • Set color for an individual bar

    Set color for an individual bar

    Using the EColumnChart is there a way that I could set a certain color for different Bars. when I create the array for the data on one day I would like a certain color and another day a different color. Other than the High and Low column colors.

    Thank you for a great control.

    opened by Sun3 1
  • Cant Set Individual Bar Column Colors

    Cant Set Individual Bar Column Colors

    Hi I want too to have different colour bars in my chart, when i implement this method it makes every bar the same colour, I'm not why this isn't working correctly? :

    -(UIColor *)colorForEColumn:(EColumn *)eColumn {
    
      if (eColumn.eColumnDataModel.index < 1) { return [UIColor purpleColor]; } else { return [UIColor redColor]; }
    
    }
    

    I am also getting "Important!! DataSource Not Set!" in the log, but I've implement all the datasource methods, so not sure if this has anything to do with the above problem.

    opened by Neilfau 0
  • How to set bar chart total value 10000 and display bars according to the value?

    How to set bar chart total value 10000 and display bars according to the value?

    For Example if value of bar is 10000 then it shows biggest. if second bar value is 5000 then it shows half of the first one and so on.

    The total value can be changed by user? How is it possible in this api?

    opened by miskeen110 0
  • Use Json to draw chart

    Use Json to draw chart

    Hi, I want to use Json to prepare data for chart. but it seems that it does not work with Json . Does it support Json? If yes, How can I draw chart with json?

    opened by moaliba 0
Owner
Scott Zhu
Scott Zhu
SwiftUI library to easily render diagrams given a tree of objects. Similar to ring chart, sunburst chart, multilevel pie chart.

Swift Sunburst Diagram Sunburst diagram is a library written with SwiftUI to easily render diagrams given a tree of objects. Similar to ring chart, su

Ludovic Landry 494 Dec 19, 2022
A powerful 🚀 Android chart view / graph view library, supporting line- bar- pie- radar- bubble- and candlestick charts as well as scaling, panning and animations.

âš¡ A powerful & easy to use chart library for Android âš¡ Charts is the iOS version of this library Table of Contents Quick Start Gradle Maven Documentat

Philipp Jahoda 36k Jan 5, 2023
iOS Chart. Support animation, click, scroll, area highlight.

XJYChart XJYChart - A High-performance, Elegant, Easy-to-integrate Charting Framework. The Best iOS Objc Charts. chart more beautiful support chart sc

junyixie 868 Nov 16, 2022
Simple iOS Application built using UIKit displaying the list of Cryptocurrencies and a detailed screen with a line graph.

CryptoViewer Simple iOS Application built using UIKit displaying the list of Cryptocurrencies and a detailed screen with a line graph. Home Screen: Di

null 0 Jun 14, 2022
An adaptive scrollable graph view for iOS to visualise simple discrete datasets. Written in Swift.

ScrollableGraphView Announcements 9-7-2017 - Version 4: Version 4 was released which adds multiple plots, dynamic reloading of values, more reference

Phillip 5.3k Jan 5, 2023
Infowind - An Open Graph Metadata extension for iOS, iPadOS & MacOS

Infowind ?? InfoWind is an Open Graph Protocol based Safari extension for iOS, i

Gokul Nair 0 Jun 22, 2022
Creates WordCloud type graph from a string or array of strings input.

CPTWordCloud Example To run the example project, clone the repo, and run pod install from the Example directory first. Requirements Installation CPTWo

Chronic Stim 1 Jan 7, 2022
SwiftyOpenGraph - A swift library that retrieves structured open graph data from webpages.

SwiftyOpenGraph Usage Initialization Base Properties Types Installation License Usage Initialization You use SwiftyOpenGraph by initializing OpenGraph

Quintschaf 1 Jan 6, 2022
A simple and beautiful chart lib used in Piner and CoinsMan for iOS(https://github.com/kevinzhow/PNChart) Swift Implementation

PNChart-Swift PNChart(https://github.com/kevinzhow/PNChart) Swift Implementation Installation This isn't on CocoaPods yet, so to install, add this to

Kevin 1.4k Nov 7, 2022
A simple and beautiful chart lib used in Piner and CoinsMan for iOS

PNChart You can also find swift version at here https://github.com/kevinzhow/PNChart-Swift A simple and beautiful chart lib with animation used in Pin

Kevin 9.8k Jan 6, 2023
A simple and animated Pie Chart for your iOS app.

XYPieChart XYPieChart is an simple and easy-to-use pie chart for iOS app. It started from a Potion Project which needs an animated pie graph without i

XY Feng 1.7k Sep 6, 2022
This is pie chart that is very easy to use and customizable design.

CSPieChart Example To run the example project, clone the repo, and run pod install from the Example directory first. Requirements Installation CSPieCh

iOSCS 40 Nov 29, 2022
JTChartView is the new lightweight and fully customizable solution to draw a chart

JTChartView JTChartView is the new lightweight and fully customizable solution to draw a curve and fill the space underneath it with a gradient. The r

Jakub Truhlář 124 Sep 7, 2022
Using Swift Charts and Voiceover Chart Descriptor to compose music. 🤯

Chart de lune ?? Using Swift Charts and Voiceover Chart Descriptor to compose music. ?? Image source: https://hadikarimi.com/portfolio/claude-debussy-

An Trinh 31 Nov 21, 2022
FSLineChart A line chart library for iOS.

FSLineChart A line chart library for iOS. Screenshots Installing FSLineChart Add the contents of the FSLineChart project to your directory or simply a

Arthur 856 Nov 24, 2022
an iOS open source Radar Chart implementation

JYRadarChart an open source iOS Radar Chart implementation ##Screenshots Requirements Xcode 5 or higher iOS 5.0 or higher ARC CoreGraphics.framework D

Johnny Wu 416 Dec 31, 2022
Easy to use Spider (Radar) Chart library for iOS written in Swift.

DDSpiderChart Easy to use Spider (Radar) Chart library for iOS written in Swift. Requirements iOS 8.0+ / macOS 10.10+ / tvOS 9.0+ / watchOS 2.0+ Xcode

Deniz Adalar 82 Nov 14, 2022
Line Chart library for iOS written in Swift

Swift LineChart Usage var lineChart = LineChart() lineChart.addLine([3, 4, 9, 11, 13, 15]) Features Super simple Highly customizable Auto scaling Touc

Mirco Zeiss 601 Nov 15, 2022
Core Charts | Basic Scrollable Chart Library for iOS

Core Charts | Basic Chart Library for iOS HCoreBarChart VCoreBarChart Requirements Installation Usage Appearance Customization Getting Started You nee

Çağrı ÇOLAK 71 Nov 17, 2022