System information
- What is the top-level directory of the model you are using:
models/research/object_detection/
- Have I written custom code:
No custom code for reproducing the bug. I have written custom code for diagnosing.
- OS Platform and Distribution:
Linux Ubuntu 16.04
- TensorFlow installed from (source or binary):
Anaconda conda-forge channel
- TensorFlow version:
b'unknown' 1.4.1 (output from
python -c "import tensorflow as tf; print(tf.GIT_VERSION, tf.VERSION)")
- CUDA/cuDNN version:
CUDA 8.0/cuDNN 6.0
- GPU model and memory:
1 TITAN X (Pascal) 12189MiB
- Exact command to reproduce:
Run the provided object detection demo (ssd_mobilenet_v1_coco_2017_11_17 model) with a small modification in the last cell to record the inference speed:
    i = 0
    for _ in range(10):
      image_path = TEST_IMAGE_PATHS[1]
      i += 1
      image = Image.open(image_path)
      # the array based representation of the image will be used later in order to prepare the
      # result image with boxes and labels on it.
      image_np = load_image_into_numpy_array(image)
      # Expand dimensions since the model expects images to have shape: [1, None, None, 3]
      image_np_expanded = np.expand_dims(image_np, axis=0)
      # Actual detection.
      options = tf.RunOptions(trace_level=tf.RunOptions.FULL_TRACE)
      run_metadata = tf.RunMetadata()
      start_time = time.time()
      (boxes, scores, classes, num) = sess.run(
          [detection_boxes, detection_scores, detection_classes, num_detections],
          feed_dict={image_tensor: image_np_expanded})
      print('Iteration %d: %.3f sec'%(i, time.time()-start_time))
The results show that the inference speed is much shower than the reported inference speed, 30ms, in the model zoo page:
Iteration 1: 2.212 sec
Iteration 2: 0.069 sec
Iteration 3: 0.076 sec
Iteration 4: 0.068 sec
Iteration 5: 0.072 sec
Iteration 6: 0.072 sec
Iteration 7: 0.071 sec
Iteration 8: 0.079 sec
Iteration 9: 0.085 sec
Iteration 10: 0.071 sec
Describe the problem
Summary:
By directly running the provided object detection demo, the observed inference speed of object detection models in the model zoo is much slower than the reported inference speed. With some hack, a higher inference speed than the reported speed can be achieved. After some diagnostics, it is highly likely that the slow inference speed is caused by:
- tf.where and other post-processing operations are running anomaly slow on GPU; or
- The frozen inference graph is lack of the ability to optimize the GPU/CPU assignment.
proof of the hypothesis: tf.where and other post-processing operations are running anomaly slow on GPU
By outputting trace file, we can diagnose the running time of each node in details.
To output the trace file, modify the last cell of object detection demo as:
from tensorflow.python.client import timeline
with detection_graph.as_default():
  with tf.Session(graph=detection_graph) as sess:
    # Definite input and output Tensors for detection_graph
    image_tensor = detection_graph.get_tensor_by_name('image_tensor:0')
    # Each box represents a part of the image where a particular object was detected.
    detection_boxes = detection_graph.get_tensor_by_name('detection_boxes:0')
    # Each score represent how level of confidence for each of the objects.
    # Score is shown on the result image, together with the class label.
    detection_scores = detection_graph.get_tensor_by_name('detection_scores:0')
    detection_classes = detection_graph.get_tensor_by_name('detection_classes:0')
    num_detections = detection_graph.get_tensor_by_name('num_detections:0')
    i = 0
    for _ in range(10):
      image_path = TEST_IMAGE_PATHS[1]
      i += 1
      image = Image.open(image_path)
      # the array based representation of the image will be used later in order to prepare the
      # result image with boxes and labels on it.
      image_np = load_image_into_numpy_array(image)
      # Expand dimensions since the model expects images to have shape: [1, None, None, 3]
      image_np_expanded = np.expand_dims(image_np, axis=0)
      # Actual detection.
      options = tf.RunOptions(trace_level=tf.RunOptions.FULL_TRACE)
      run_metadata = tf.RunMetadata()
      start_time = time.time()
      (boxes, scores, classes, num) = sess.run(\
      [detection_boxes, detection_scores, detection_classes, num_detections], \
      feed_dict={image_tensor: image_np_expanded}, \
      options=options, run_metadata=run_metadata)
      print('Iteration %d: %.3f sec'%(i, time.time()-start_time))
      # Visualization of the results of a detection.
      vis_util.visualize_boxes_and_labels_on_image_array(
        image_np,
        np.squeeze(boxes),
        np.squeeze(classes).astype(np.int32),
        np.squeeze(scores),
        category_index,
        use_normalized_coordinates=True,
        line_thickness=8)

    plt.figure(figsize=IMAGE_SIZE)
    plt.imshow(image_np)

    fetched_timeline = timeline.Timeline(run_metadata.step_stats)
    chrome_trace = fetched_timeline.generate_chrome_trace_format()
    with open('Experiment_1.json' , 'w') as f:
      f.write(chrome_trace)
The output json file has been included in the .zip file in the source code section below.
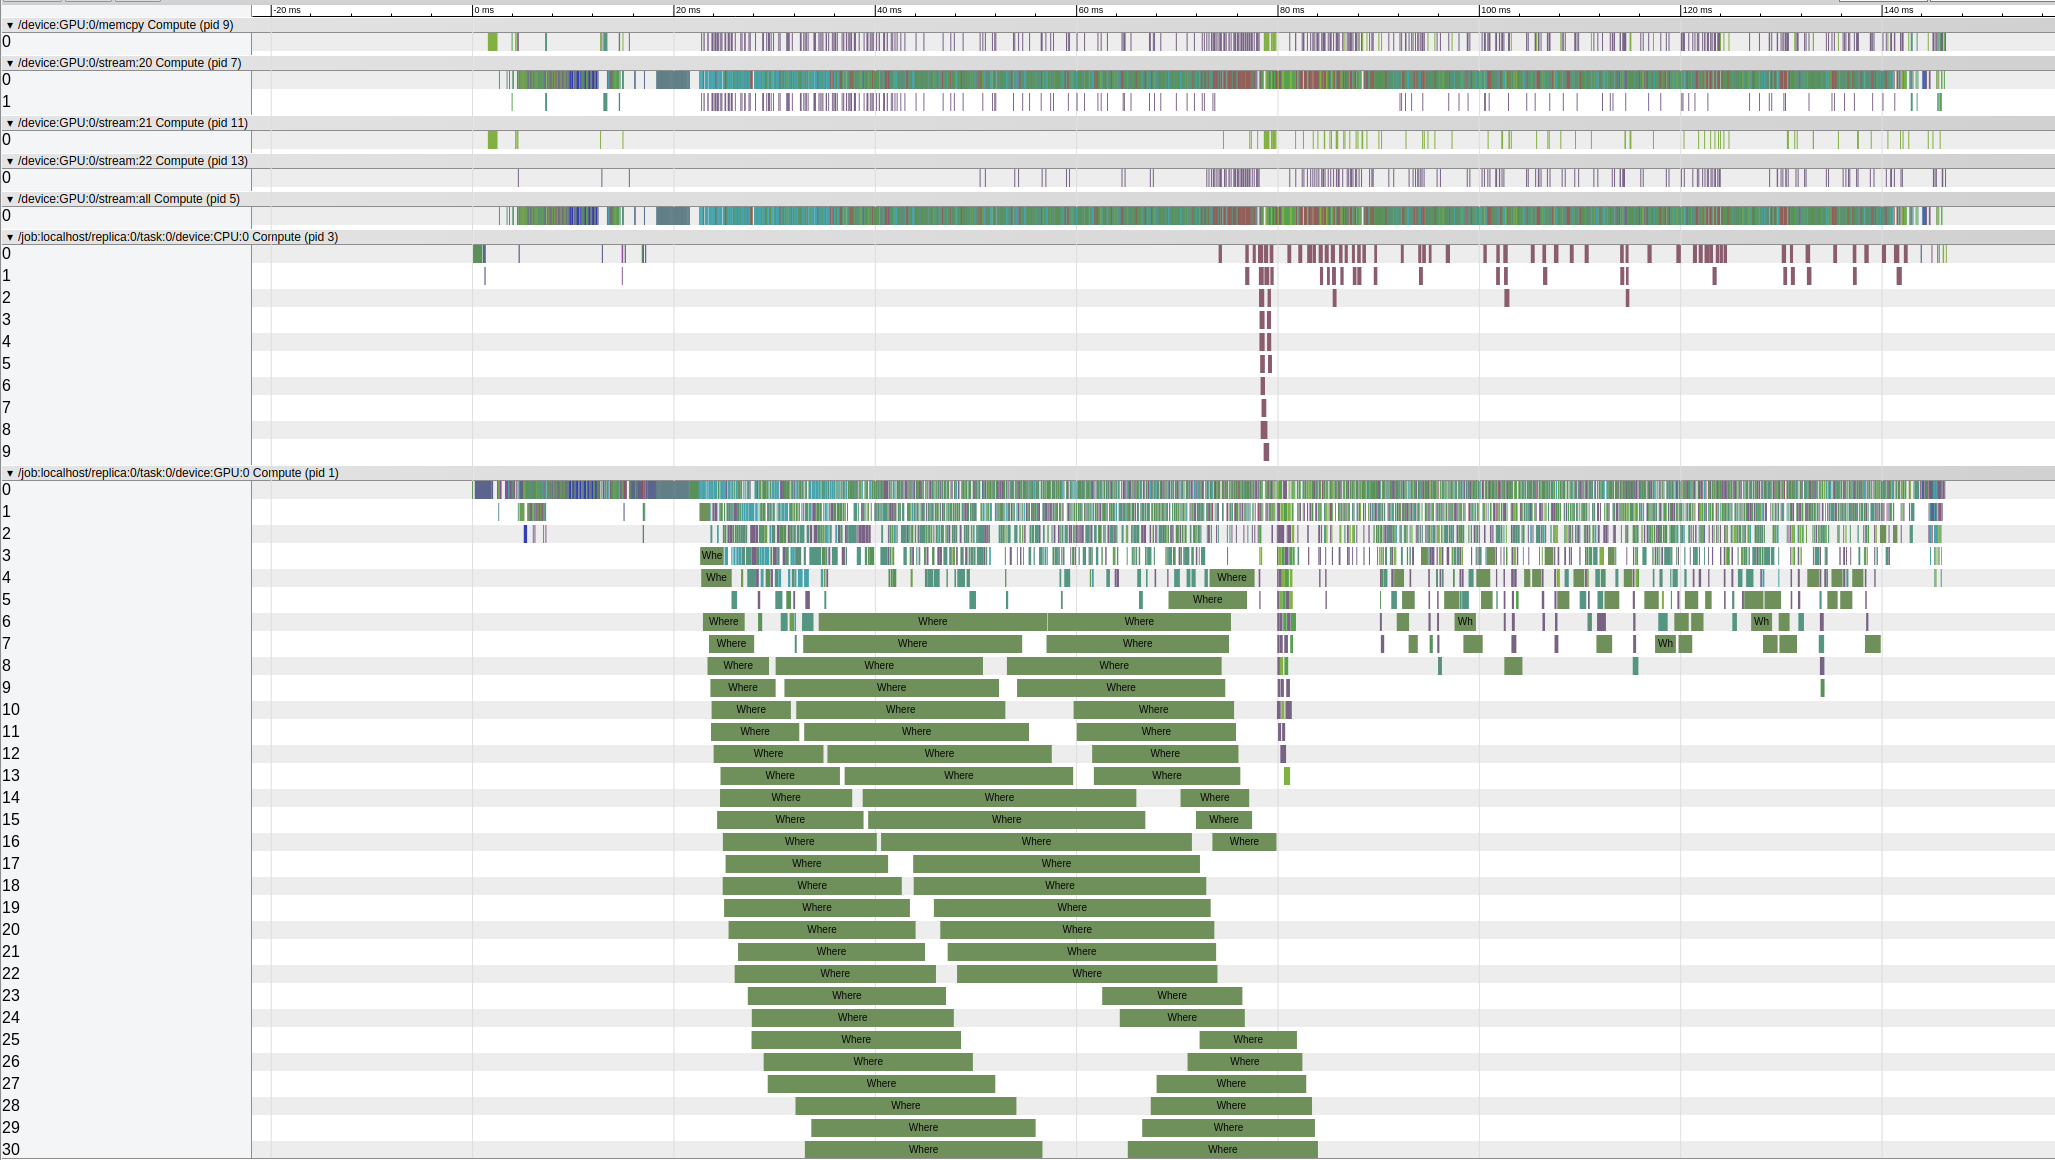
Visualizing the json file in chrome://tracing/ gives:

The CNN related operations end at ~13ms and the rest post-processing operations take about 133ms. We have noticed that adding the trace function will further slow down the inference speed. But it is shows clearly that the post-processing operations (post CNN) run very slowly on GPU.
As a comparison, one can run the object detection demo with GPU disabled, and profile the running trace using the same method. To disable GPU, add os.environ['CUDA_VISIBLE_DEVICES'] = '' in the first row of the last cell.
The output json file has been included in the .zip file in the source code section below.
Visualizing this json file in chrome://tracing/ gives:

By running everything on CPU, the CNN operations end at roughly 63ms and the rest post-processing operations only takes about 15ms on CPU which is significantly faster than the time they take when running on GPU.
proof of the hypothesis: The frozen inference graph is lack of the ability to optimized the GPU/CPU assignment
We add some hack trying to see can we achieve a higher inference speed. The hack is manually assigning the CNN related nodes on GPU and the rest nodes on CPU. The idea is using GPU to accelerate only CNN operations and leave the post-processing operations on CPU.
The source code has been included in the .zip file in the source code section below.
With this hack, we are able to observe a higher inference speed than the reported speed.
Iteration 1: 1.021 sec
Iteration 2: 0.027 sec
Iteration 3: 0.026 sec
Iteration 4: 0.027 sec
Iteration 5: 0.026 sec
Iteration 6: 0.026 sec
Iteration 7: 0.026 sec
Iteration 8: 0.031 sec
Iteration 9: 0.031 sec
Iteration 10: 0.026 sec
To verify the hypothesis, here are some questions we need from the tensorflow team:
-
Are the numbers of inference speed reported on the detection model zoo page tested on the frozen inference graphs or original graphs?
-
Are the slow tf.where and other post-processing operations supposed to run on GPU or CPU? Is the slow running speed on GPU normal?
-
Is there a device assigning function to optimize the GPU/CPU use in the original tensorflow graphs? Is that function missing in the frozen inference graphs?
Source code / logs
tensorflowissue.zip


