Repository with example app for using Bar chart

Overview

Gráfico de Barras (Exemplo)

Repositório com app exemplo para o uso do gráfico de Barras.

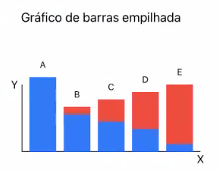
O gráfico de barras é um gráfico com barras retangulares e comprimento proporcional aos valores que ele apresenta.

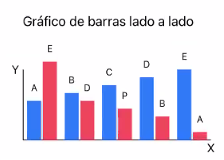
Alguns gráficos de barra apresentam barras agrupadas em grupos (gráficos de barras agrupadas) e outros mostram as barras divididas em sub-partes para mostrar efeito acumulativo. Um eixo do gráfico mostra especificamente o que está sendo comparado enquanto o outro eixo representa valores discretos.


11-04 13_55_10-Window 5-Window 2021-11-04 13_55_56-Window

Passos

1. Criando uma estrutura básica para a utilização do Framework

WhatsApp Image 2021-11-03 at 16 45 04 fonte: https://www.fm2s.com.br/grafico-de-dispersao/

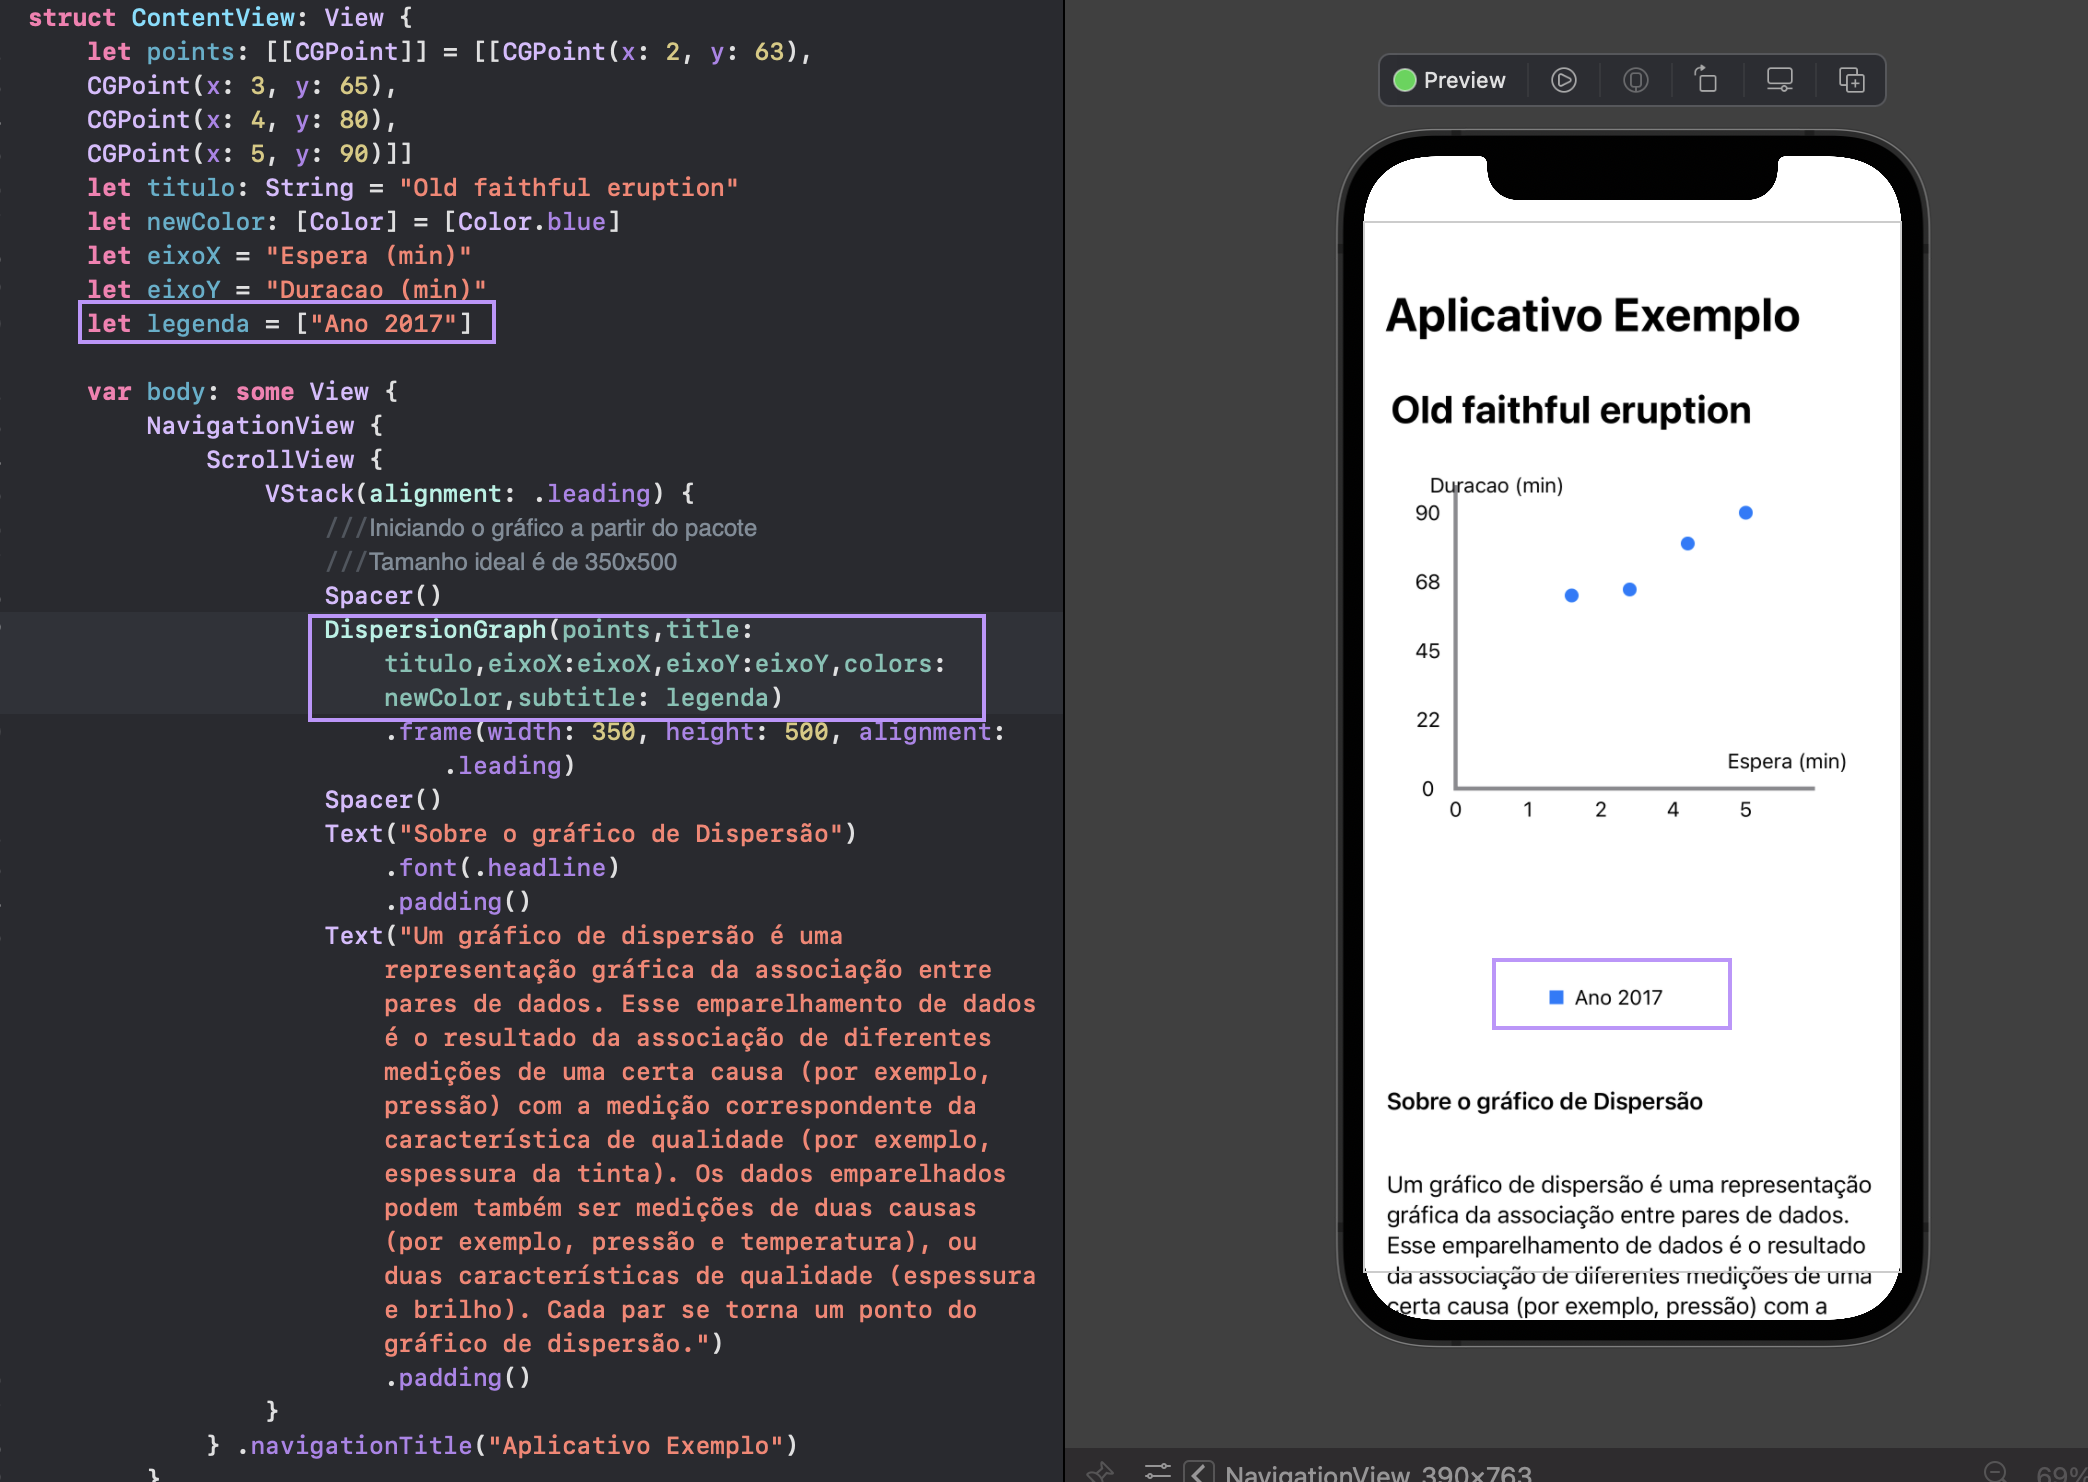
2. Substituindo o etângulo preto pelo gráfico

Como utilizar a classe?

DispersionGraph( data: [[CGPoint]],title:String, eixoX:String, eixoY: String,colors: [Color],subtitle: [String]))

Primordialmente o gráfico deve receber uma matriz de CGPoints "x, y", já que o gráfico de Dispersão é uma representação da associação entre pares de dados e pode ser feita entre um ou mais tipos de pares. No primeiro exemplo, vamos testar apenas com um tipo. Captura de Tela 2021-11-04 às 13 38 34

  • points: [[CGPoints]]
    ⚠️ Use o nome da classe do gráfico para instanciar o gráfico em seu projeto: DispersionGraph
    ⚠️ Passe como parâmetro, para o seu gráfico, uma matriz com CGPoints. Nesse primeiro exemplo temos apenas um dado na matriz, já que estamos analisando apenas um dado
    ⚠️ Lembre-se de setar uma configuração de tamanho para o seu gráfico. Recomendamos no mínimo 350x500

6. Personalizando o gráfico

Título

⚠️ Passe mais um parâmetro para o seu gráfico, com o título desejado
title: String
Captura de Tela 2021-11-04 às 13 53 47

Cores

⚠️ Passe para seu gráfico, como parâmetro, um vetor de Cores (tipo Color). Seu vetor deve conter a mesma quantidade de cores que as variáveis. No caso, vamos utilizar apenas uma cor por estarmos analisando apenas um par de dados variável

  • colors: [Color]

Captura de Tela 2021-11-04 às 13 55 42

Eixos

⚠️ Passe mais dois parâmetros para o seu gráfico, com o nome de cada eixo
⚠️ Lembre-se de declarar os eixos antes do valor da cor, quando for passar para a função do gráfico

  • eixoX: String
  • eixoY: String

Captura de Tela 2021-11-04 às 14 05 48

Legenda

⚠️ Passe mais um parâmetro para o seu gráfico, com o nome de cada variável

  • subtitle: [String]

Captura de Tela 2021-11-04 às 14 08 06

Teste com múltiplas variáveis

⚠️ Testando agora com mais um par de variáveis
⚠️ Para esse teste, não atribuímos cores pois o framework possui sua paleta padrão (para 7 pares de variávies no máximo)

Captura de Tela 2021-11-04 às 14 13 53

You might also like...
A simple and beautiful chart lib used in Piner and CoinsMan for iOS

PNChart You can also find swift version at here https://github.com/kevinzhow/PNChart-Swift A simple and beautiful chart lib with animation used in Pin

iOS Chart. Support animation, click, scroll, area highlight.

XJYChart XJYChart - A High-performance, Elegant, Easy-to-integrate Charting Framework. The Best iOS Objc Charts. chart more beautiful support chart sc

iOS/iPhone/iPad Chart, Graph. Event handling and animation supported.

#EChart A highly extendable, easy to use chart with event handling, animation supported. ##Test How To Use Download and run the EChartDemo project is

FSLineChart  A line chart library for iOS.
FSLineChart A line chart library for iOS.

FSLineChart A line chart library for iOS. Screenshots Installing FSLineChart Add the contents of the FSLineChart project to your directory or simply a

ANDLineChartView is easy to use view-based class for displaying animated line chart.

ANDLineChartView for iOS ANDLineChartView is easy to use view-based class for displaying animated line chart. Usage API is simple. Just implement foll

Flower-like chart written in Swift

FlowerChart - custom chart written in Swift Fully vector flower-shaped chart written in Swift Flower-shaped chart written in Swift, this repo is a sam

an iOS open source Radar Chart implementation

JYRadarChart an open source iOS Radar Chart implementation ##Screenshots Requirements Xcode 5 or higher iOS 5.0 or higher ARC CoreGraphics.framework D

This is pie chart that is very easy to use and customizable design.

CSPieChart Example To run the example project, clone the repo, and run pod install from the Example directory first. Requirements Installation CSPieCh

Easy to use Spider (Radar) Chart library for iOS written in Swift.

DDSpiderChart Easy to use Spider (Radar) Chart library for iOS written in Swift. Requirements iOS 8.0+ / macOS 10.10+ / tvOS 9.0+ / watchOS 2.0+ Xcode

Owner
Felipe Leite
Felipe Leite
SwiftUI library to easily render diagrams given a tree of objects. Similar to ring chart, sunburst chart, multilevel pie chart.

Swift Sunburst Diagram Sunburst diagram is a library written with SwiftUI to easily render diagrams given a tree of objects. Similar to ring chart, su

Ludovic Landry 494 Dec 19, 2022
SwiftUI Bar Chart

SwiftUI BarChart Lightweight and easy to use SwiftUI chart library for all Apple platforms Features Scaling on both axes Fully customizable axes (labe

Roman Baitaliuk 158 Jan 6, 2023
A powerful 🚀 Android chart view / graph view library, supporting line- bar- pie- radar- bubble- and candlestick charts as well as scaling, panning and animations.

⚡ A powerful & easy to use chart library for Android ⚡ Charts is the iOS version of this library Table of Contents Quick Start Gradle Maven Documentat

Philipp Jahoda 36k Jan 5, 2023
Draw a chart with progress bar style

ChartProgressBar-iOS Draw a chart with progress bar style - the android version here Installation iOS version (9.0,*) Swift 3.2 Using cocoapods : pod

Hadi Dbouk 84 Apr 25, 2022
MSBBarChart is an easy to use bar chart library for iOS

MSBBarChart MSBBarChart is an easy to use bar chart library for iOS. Usage if you want to hide label above bar barChart.setOptions([.isHiddenLabelAbov

misyobun 45 May 3, 2022
Demonstrate a way to build your own line chart without using any third-party library

LineChart This code demonstrate a way to build your own line chart without using any third-party library. It contains a simple yet effective algorithm

Van Hung Nguyen 0 Oct 17, 2021
Using Swift Charts and Voiceover Chart Descriptor to compose music. 🤯

Chart de lune ?? Using Swift Charts and Voiceover Chart Descriptor to compose music. ?? Image source: https://hadikarimi.com/portfolio/claude-debussy-

An Trinh 31 Nov 21, 2022
A simple and animated Pie Chart for your iOS app.

XYPieChart XYPieChart is an simple and easy-to-use pie chart for iOS app. It started from a Potion Project which needs an animated pie graph without i

XY Feng 1.7k Sep 6, 2022
A simple and beautiful chart lib used in Piner and CoinsMan for iOS(https://github.com/kevinzhow/PNChart) Swift Implementation

PNChart-Swift PNChart(https://github.com/kevinzhow/PNChart) Swift Implementation Installation This isn't on CocoaPods yet, so to install, add this to

Kevin 1.4k Nov 7, 2022
TKRadarChart - A customizable radar chart in Swift

TKRadarChart A customizable radar chart in Swift Requirements iOS 8.0+ Xcode 9.0 Swift 4.0 Installation CocoaPods You can use CocoaPods to install TKR

TBXark 203 Dec 28, 2022